Video Lesson: How to Calculate and Interpret Z-Scores
What is a Z-Score?
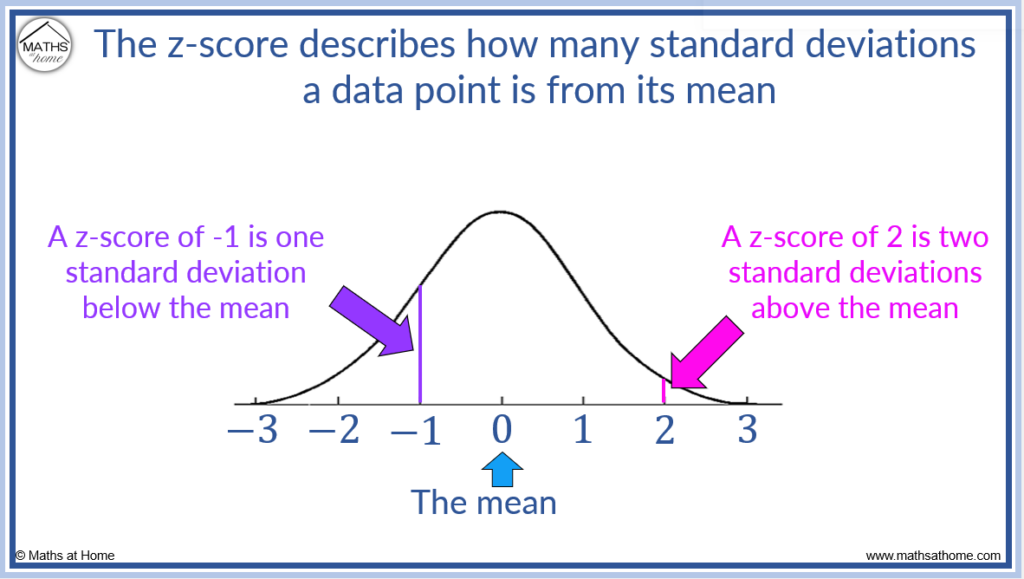
The z-score describes how many standard deviations a raw score is above the mean. Negative z-scores indicate a position below the mean. For example, a z-score of 2 means two standard deviations above the mean and a z-score of -1 means one standard deviation below the mean.
This can be seen in the diagram below in which the position of the z-scores are labelled on the horizontal axis.
A z-score of zero means that the raw score is identical to the mean. In other words, the raw score is zero standard deviations away from the mean and is therefore equal to the mean.
Z-scores can be negative or positive. Negative z-scores indicate raw scores that are below the mean and positive z-scores indicate raw scores which are above the mean.
z-scores close to zero indicate that the result is close to the mean, whereas larger or very negative z-scores indicate that the result is further from the mean.
z-scores greater than +3 or less than -3 are considered outliers. This is because an outlier can be defined as a value that is more than 3 standard deviations above or below the mean.
Calculating the z-score is used to compare scores from different sets of data that have different means and standard deviations.
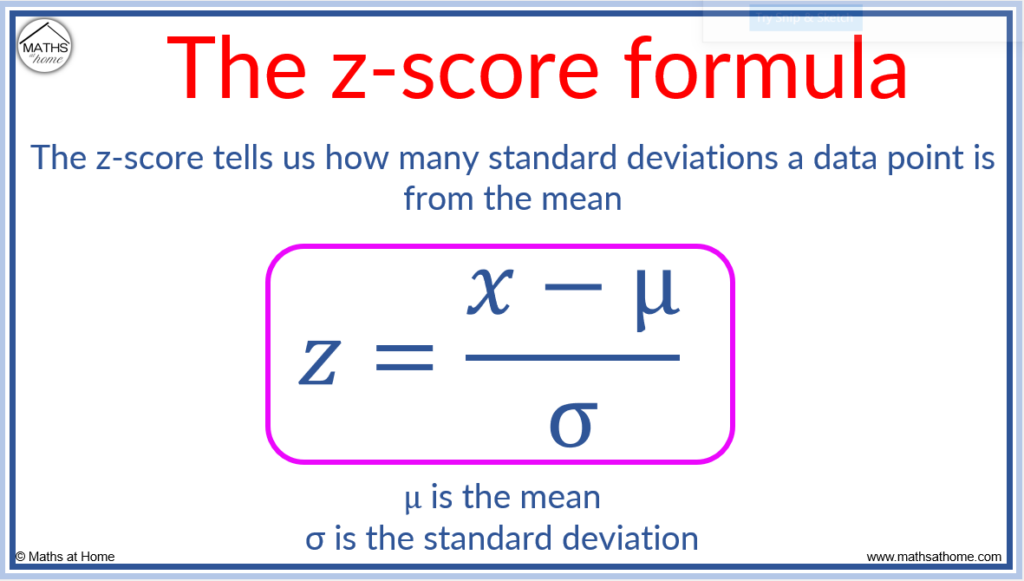
The z-score is calculated using the following formula:
The formula to calculate the z-score
is the raw score
is the mean
is the standard deviation
A z-score does not have any units. It is a value that describes how many standard deviations a result is from its mean.
Why is a z-score important?
Calculating the z-score is useful because it allows us to:
- Compare scores that have different means and standard deviations
- Calculate the probability of a particular score occurring
The Probability Density Function of the Z-Distribution
The z-score can be used to normalise a set of values in a normal distribution by calculating the z-score of every value in the data set. This results in the mean of 0 and a standard deviation of 1. The resulting distribution is known as a standard normal distribution.
The probability density function for the standard normal distribution is:
.
The standard normal distribution is a normal distribution with a mean of 0 and a standard deviation of 1.

How to Calculate a Z-Score
To calculate the z-score, use the formula z=(x-μ)/σ, where x is the raw score, μ is the mean and σ is the standard deviation. In words, subtract the mean from the raw score and then divide by the standard deviation. The z-score is a measure of how many standard deviations a value is from the mean.
The formula to calculate the z-score
To calculate the z-score in steps:
- Subtract the mean from the raw score
- Divide by the standard deviation
Consider the following examples:
My time to run 200m is 28 seconds. The mean time for this race is 31 seconds and the standard deviation is 1.5 seconds.
My time to run 500m is 132 seconds. The mean time for this race is 125 seconds and the standard deviation is 8.2 seconds.
Calculate the z-score for each race.

In the 200m race:
- The raw score,
- The mean,
- The standard deviation,
becomes
.
28 – 31 = -3 and -3 divided by 1.5 = -2.
For the 200m race, z = -2.
For the 500m race:
- The raw score,
- The mean,
- The standard deviation,
becomes
.
132 – 125 = 7 and 7 divided by 8.2 = 0.854.
For the 500m race, z = 0.854.
How to Interpret Z-Scores
The z-score is used to normalise data with different means and standard deviations. This allows data to be compared even if they have different parameters. The z-score of multiple data sets can be found and the larger the z-score, the greater its position above the mean.
Consider the following examples:
My time to run 200m is 28 seconds. The mean time for this race is 31 seconds and the standard deviation is 1.5 seconds.
My time to run 500m is 132 seconds. The mean time for this race is 125 seconds and the standard deviation is 8.2 seconds.
- For the 200m race, the z-score is -2
- For the 500m race, the z-score is 0.854
This means that the time in the 200m race is two standard deviations less than the mean time.
We can see that the mean is 31 and the standard deviation is 1.5.
Subtracting two lots of the standard deviation from the mean, we obtain the raw score:
In the 500m race, the time is 0.854 standard deviations above the mean.
We can see that the mean is 125 and the standard deviation is 8.2.
We can add 0.854 lots of the standard deviation to obtain the raw score:

We can see that the z score of -2 corresponds to a time which is less than the mean time and is located on the left of the mean.
The z-score of 0.854 corresponds to a time which is greater than the mean time and is located on the right of the mean.
In this example, a lower time would be preferable when completing a race and so, the lower z-score would be best.
This process allows for a comparison to be made between the two races despite different mean times and standard deviations.
Z-Scores for Confidence Intervals
Z-scores are used to calculate desired confidence intervals and the z-score used depends on the level of confidence required.
Confidence intervals for a mean are written in the form:
is the z-score for the required level of confidence that we require.

For example, on a standard normal distribution as shown above, in which the shaded region is between the z-scores of -1.96 and 1.96, the shaded region will occupy 95% of the area.
Therefore a is required for a 95% confidence interval.
The following table lists the z-scores required for a given confidence interval.
| Confidence Level | z-score |
| 80% | 1.282 |
| 85% | 1.440 |
| 90% | 1.645 |
| 95% | 1.960 |
| 98% | 2.326 |
| 99% | 2.576 |
| 99.5% | 2.807 |
| 99.9% | 3.291 |
How to Calculate Z-Scores for Confidence Intervals
To calculate the z-score of a confidence interval:- Subtract the confidence level (as a decimal) from 1.
- Divide by 2.
- Subtract this result from 1.
- Look up this area in the z-table to obtain the z-score.
For example, calculate the z-score required for a 92% confidence interval.
Step 1. Subtract the confidence level (as a decimal) from 1
1 – 0.92 = 0.08.
Step 2. Divide by 2
0.08 ÷ 2 = 0.04
Step 3. Subtract this result from 1
1 – 0.04 = 0.96
Step 4. Look up this area in the z-table to obtain the z-score
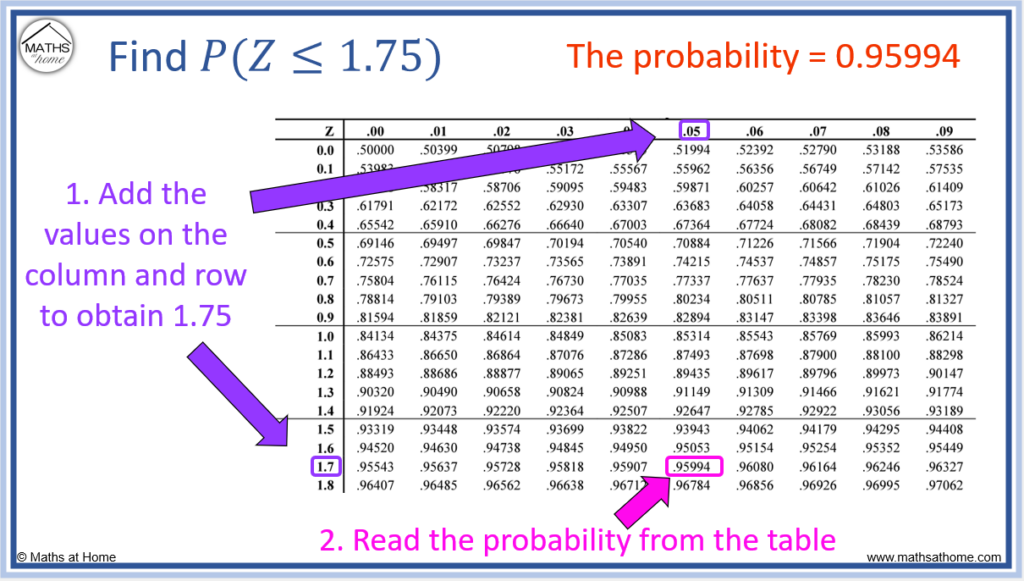
We look for the value closest to 0.96 in the middle of the z-table.
We can see this is 0.95994 in the table shown below.
To obtain the z-score, add the numbers in the row and column that are in line with this.
1.7 + 0.05 = 1.75 and so, the required z-score is 1.75.

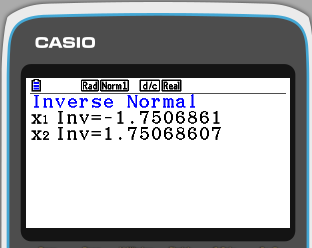
How to Find the Z-Score for a Confidence Interval on a Calculator
To find the required z-score on a calculator:
- Use the Inverse Normal function and set the mean as 0 and the standard deviation as 1
- Set the area as the required confidence level and the tail as central
The required z-score is then calculated as shown below.
For a 92% confidence interval, the z-score is approximately 1.75.

How to Find an Unknown Mean or Standard Deviation Using Z-Scores
To find an unknown mean or standard deviation, convert the given percentage into a z-score and set this equal to (x-µ)/σ. Substitute in the given values of x, µ or σ and solve for the desired parameter.
For example, the weights of parcels are normally distributed with a standard deviation of 50 grams. If 20% of parcels weigh less than 650 grams, find the mean weight of the parcels.
Writing this as a z-score, with a probability of weighing less than 650 grams being equal to 20%:
.
Then the inverse normal function can be used to calculate the z-score which corresponds to an area of less than 20%.
Setting the tail as left and the area as 0.2, the corresponding z-score = -0.842.
Therefore
This equation is then solved for the mean to obtain µ = 692.1.

Z-Score From Excel
To calculate z-scores on excel, use the =AVERAGE() function to calculate the mean, use the = STDEV.P() function to calculate the standard deviation and then subtract the mean from each data value and divide the results by the standard deviation.
In the example below we will calculate the z-scores of the data: 1, 3, 3, 5, 7, 11, 30.
We first find the mean by using the =AVERAGE() function. We simply select the data range to write within the brackets.
Our data is listed from cell A2 to cell A8 and therefore we write A2:A8 inside the brackets.

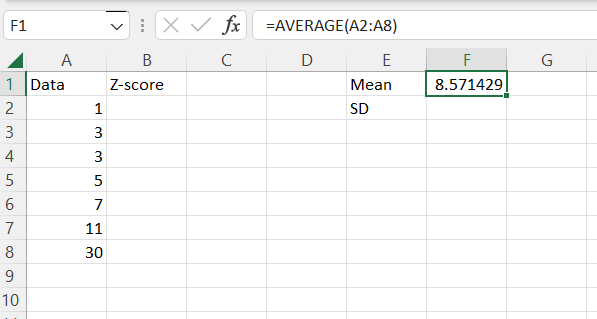
The standard deviation is calculated using the =STDEV.P() function. Again, we put A2:A8 inside the brackets because this is our total data set range.
We now have the mean in cell F1 and the standard deviation in cell F2.
To calculate the z-score, subtract the cell with the mean from each of the data values and divide them by the standard deviation.
We use the formula for a z-score, .
In our example below, we write =(A2-$F$1)/$F$2.
This is because F1 is the mean and F2 is the standard deviation. We put dollar signs in front of the F and in front of the number so that those cells are always used in future calculations.


We can put the mouse in the bottom corner of the cell B2 and drag downwards to fill out the z-scores of the other data values in one go as shown below. It is important to write the dollar signs mentioned previously in order for this to work.

How to use a Z-Score Probability Table
Z-score tables are used to calculate the probability of a raw score occurring that is less than a particular z-score. The z-score is comprised of the sum of the two numbers at the left of the row and the top of the column. The probabilities are the values in the middle of the table, in line with the z-score values.
For example, calculate .
We want to find the probability that the z-score is less than 1.75.
We go to the 1.7 row and across to the 0.05 column because 1.7+0.05 = 1.75.
We then read the value from the middle of the table in line with both 1.7 and 0.05.
This is 0.95994 and therefore .