Video Lesson: How to Calculate Variance
What is Variance?
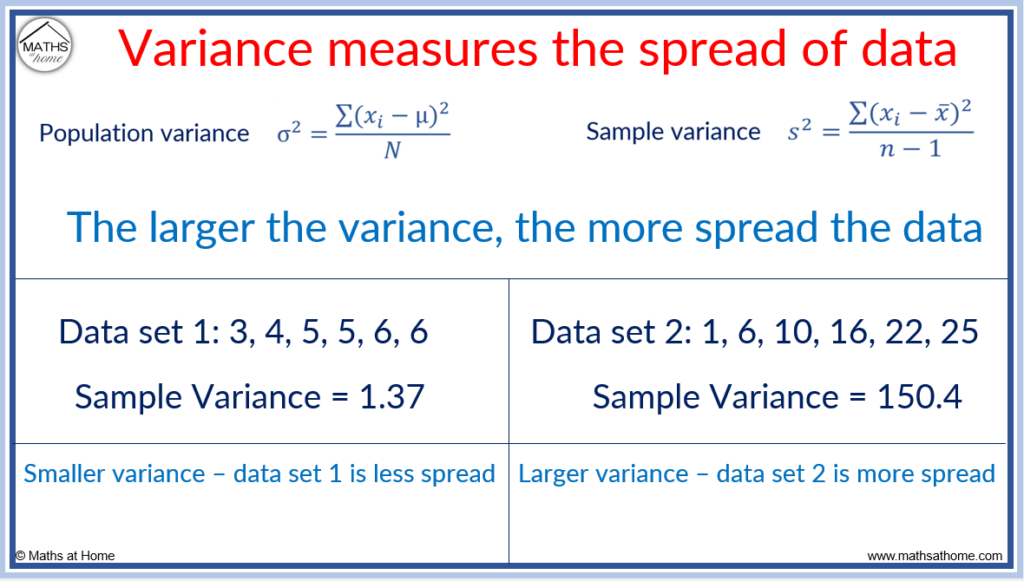
Variance is a measurement of the variability or spread in a set of data. It is calculated as the average of the squared deviations from the mean. The larger the variance, the more spread a set of data is. The variance is the square of the standard deviation.
The units of variance are the square of the units measured in the data set. For example, if the data measured is in seconds, then the variance is measured in seconds squared.
The variance does not have its own symbol and instead is written as the square of the standard deviation.
- The sample variance is written using s2, where s is the sample standard deviation.
Sample variance formula
- The population variance is written as σ2, where σ is the population standard deviation.
Population variance formula
The mean is the average of the data, whereas the variance is a measure of how far each value in the data set is from the mean. The mean is a measure of centre and the variance is a measure of spread.
The variance depends on the value of the mean.
If the numbers in the data set are close to the mean, the data set will have a smaller variance.
If the numbers in the data set are far from the mean, the data set will have a higher variance.

The variance of a set of data cannot be negative. This is because the values are squared as part of the variance calculation. Squaring numbers always creates a positive result.
The variance of a set of data can be zero only if all of the numbers in the data set are equal. The variance is a measure of how spread out the numbers in the data set are. A variance of zero means that there is no spread in the data. The only way for this to occur is if all numbers are identical.
If the variance is not zero, it must be positive.
Small variance values indicate that there is little spread in the data. The closer the variance value is to zero, the less spread out the data is.
How to Calculate the Variance of a Data Set
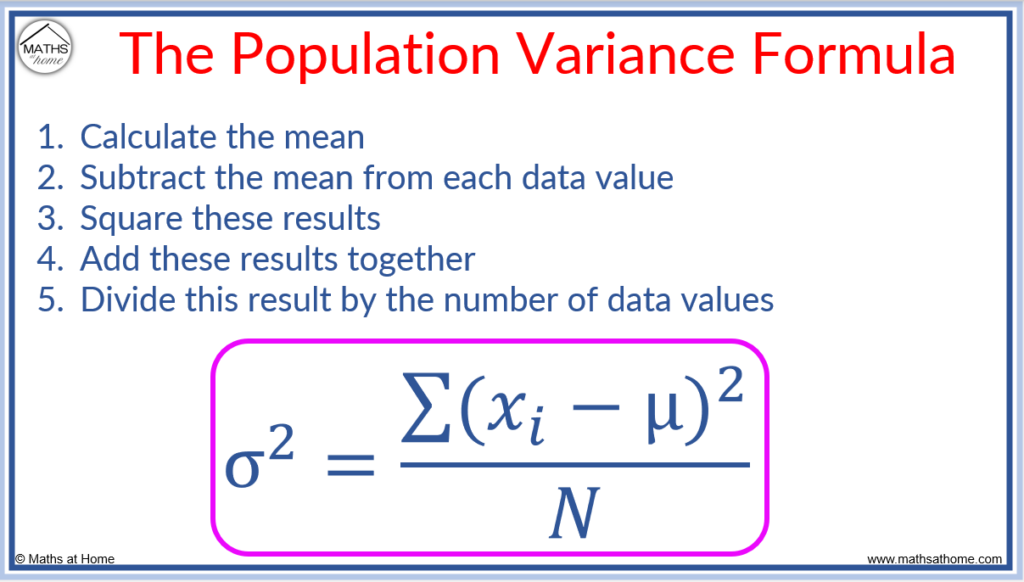
To calculate the variance:
- Calculate the mean.
- Subtract the mean from each data value.
- Square these individual results.
- Add these results together.
- Divide this total by n-1 (for sample variance) or N (for population variance).
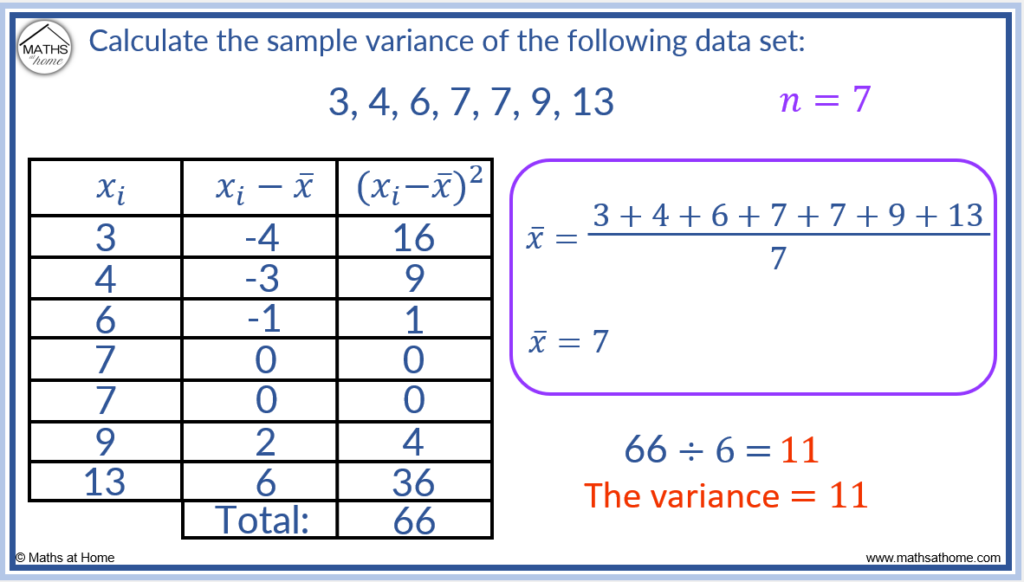
Example: Calculate the sample variance of the following data
3, 4, 6, 7, 7, 9, 13

Step 1. Calculate the mean
The mean, is given by the formula:
.
To calculate the mean add the data values and divide by the number of data values.
Adding the data values: 3 + 4 + 6 + 7 + 7 + 9 + 13 = 49
There are 7 data values in the set so 49 ÷ 7 = 7.
The mean, .
Step 2. Subtract the mean from each data value
A table is constructed with the data listed in the first column as xi.
The mean is subtracted from each individual value and written in the second column as xi-x̄.
| xi | xi-x̄ | (xi-x̄)2 |
| 3 | -4 | |
| 4 | -3 | |
| 6 | -1 | |
| 7 | 0 | |
| 7 | 0 | |
| 9 | 2 | |
| 13 | 6 |
Step 3. Square these results
The values of xi-x̄ are squared to obtain (xi-x̄)2.
These values are written in the third column of the table.
| xi | xi-x̄ | (xi-x̄)2 |
| 3 | -4 | 16 |
| 4 | -3 | 9 |
| 6 | -1 | 1 |
| 7 | 0 | 0 |
| 7 | 0 | 0 |
| 9 | 2 | 4 |
| 13 | 6 | 36 |
Step 4. Add these results together
The sum of the values of (xi-x̄)2 are found as 16 + 9 + 1 + 0 + 0 + 4 + 36 = 66.
Step 5. Divide this result by n-1
For a sample variance, the sum of the (xi-x̄)2 values is divided by n-1, where n is the number of data values.
In this example, the sum of (xi-x̄)2 is 66 and n is 7.
Therefore n-1 = 6.
66 ÷ 6 = 11 and so, the sample variance of this data set is 11.
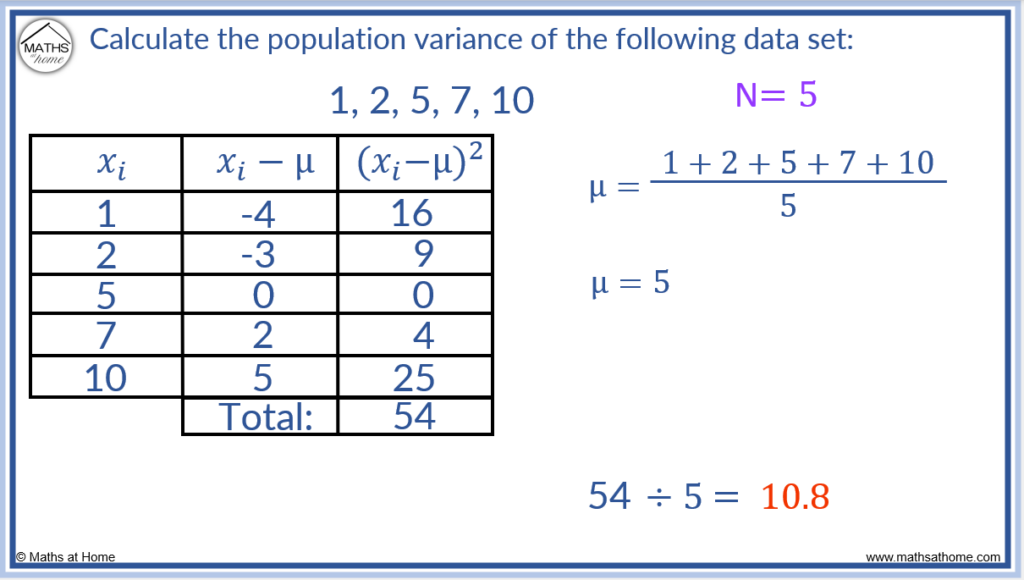
Example: Calculate the population variance of the following data
1, 2, 5, 7, 10
Step 1. Calculate the mean.
The mean is found by summing the numbers in the data set and dividing by the number of numbers in the data set.
, where
are the individual data values and N is the number of data values
The sum of the values is 1 + 2 + 5 + 7 + 10 = 25
There are 5 data values, so N = 5.
25 ÷ 5 = 5 and so, the population mean,
Step 2. Subtract the mean from each data value
The mean is 5. We subtract this from each of the data values.
We first create a table to organise the data with the data listed in the first column as xi.
We subtract the mean of 5 from each of these values to obtain the second column of the table, xi-µ.
| xi | xi-µ | (xi-µ)2 |
| 1 | -4 | |
| 2 | -3 | |
| 5 | 0 | |
| 7 | 2 | |
| 10 | 5 |
Step 3. Square these results
We square the values in the second column, xi-µ to obtain the values in the third column, (xi-µ)2.
| xi | xi-µ | (xi-µ)2 |
| 1 | -4 | 16 |
| 2 | -3 | 9 |
| 5 | 0 | 0 |
| 7 | 2 | 4 |
| 10 | 5 | 25 |
Step 4. Add these results together
We find the sum of the (xi-µ)2 values by adding them.
16 + 9 + 0 + 4 + 25 = 54
Step 5. Divide this result by the number of data values
There are 5 data values in the data set.
N = 5.
Therefore we divide the sum of the (xi-µ)2 values by 5.
54 ÷ 5 = 10.8
Therefore the population variance of this data set is 10.8.
The Difference Between Sample Variance and Population Variance
The population variance is calculated when the data considered is that of an entire population. The sample variance is used when the data considered is a sample of a larger set of data. The population variance formula has a denominator of ‘N’, whereas the sample variance formula has a denominator of ‘n-1’.
- N is the size of the entire population of data
- n is the size of the sample
N is always greater than or equal to n because n is a sample of N.
Population variance is calculated whenever data concerning the whole population is known. The mean used is the population mean, which is the known average of the entire population. The population mean is given by the symbol µ.
Sample variance is calculated when a sample of a larger set of data has been taken. The mean used is the sample mean, which is the mean of the data in the sample. The sample mean is given by the symbol x̄.
In the example shown below, the sample size is 4 and the population size is 64.
Therefore N = 64 and n = 4.
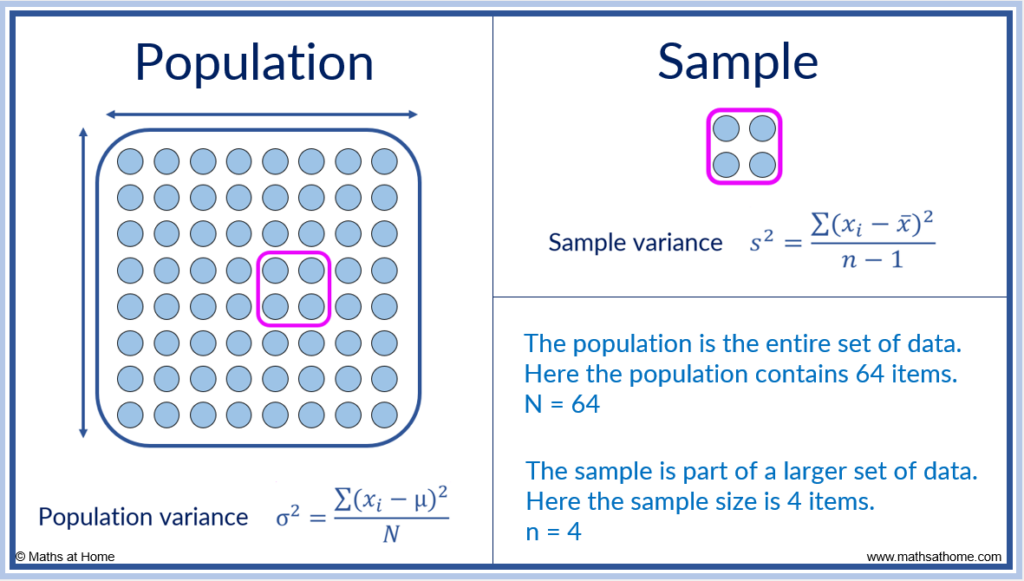
The population variance has the formula .
The sample variance has the formula .
We can see that the denominator is different in both formulae.
In sample variance and standard deviation, a denominator of n-1 is used to reduce bias in the estimation of the population. Samples are taken to give an indication of the entire population data. Dividing by n-1 gives a sample variance or standard deviation that better reflects the population variance or standard deviation.
The denominator of ‘n-1’ is known as Bessel’s Correction Factor.
A division by ‘n-1’ is made in sample variance as it represents the number of degrees of freedom in the sample. The degrees of freedom is ‘n-1’ because the sample size is finite and the sample mean is known.
To explain this, consider a bookshelf full of books in which a sample of 4 books are considered. The total width of the 4 books is found to be 120mm and therefore the sample mean thickness of each book is 30mm.
If the width of the first book is measured to be 25mm, then the remaining 3 books must have a total width of 95mm. The width of the first book is the first degree of freedom.
If the width of the second book is measured to be 35mm, then the remaining 2 books must have a total width of 55mm. The width of the second book is the second degree of freedom.
If the width of the third book is measured to be 32mm, then the remaining book must have a total width of 23mm. The width of the third book is the third degree of freedom.
We do not need to measure the width of the fourth book as we already know it is 23mm wide. We found this by subtracting the other known values from the total width.
Therefore for a sample of 4 books, there were 3 degrees of freedom or three data values that are measured to calculate the sample variance.
The sample variance and standard deviation more accurately reflect the population variance and population standard deviation when the sample size is larger.
Variance from Standard Deviation
Both variance and standard deviation measure the spread of data. The variance is the square of the standard deviation. To find the variance from the standard deviation, square the standard deviation. To find the standard deviation from the variance, square root the variance.
The formula for population standard deviation is .
The formula for population variance is .
We see that we simply square the standard deviation to obtain the variance.
For example, if the standard deviation of a population is 2.3, then the variance of the population is 2.32 which is 5.29.
The variance is a measure of the average squared deviations from the mean.
In the standard deviation calculation, the square root cancels out the effect of the squaring that also takes place within the formula. Therefore the standard deviation can produce values that are easier to work with whilst still describing the spread of data.
Variance Formula
The sample variance is denoted with s2 and can be calculated using the formula: s2=∑(xi-x̄)2/[n-1]. In this formula xi represents each of the data values, x̄ is the sample mean and n is the number of data values.
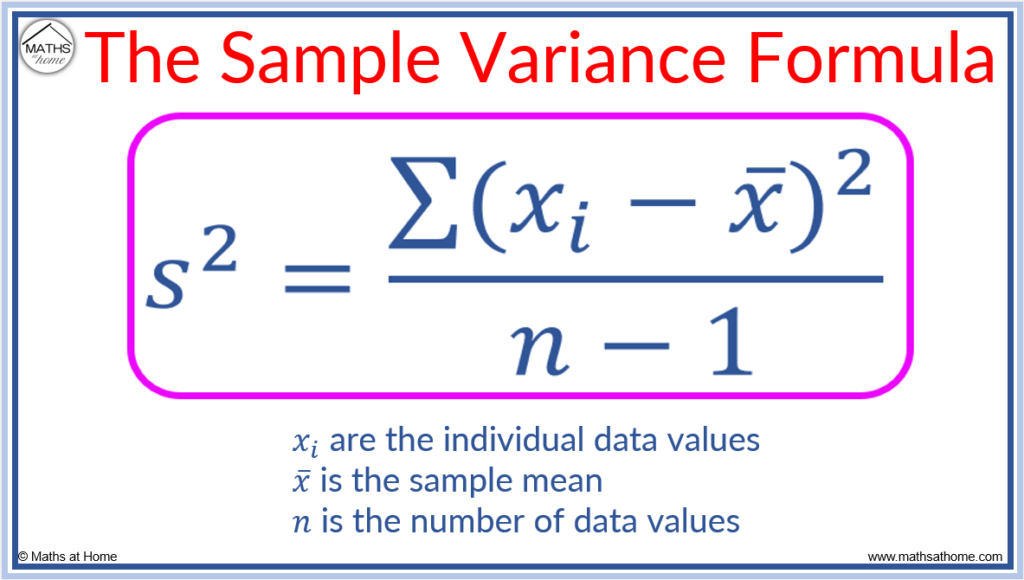
- s2 = the sample variance
- xi = the individual data values
- x̄ = the sample mean
- n = the number of data values in the sample
The Σ symbol means to sum the values.
The formula can be explained in words as:
- Subtract the mean from each data value
- Square these answers
- Add these answers up
- Divide by one less than the number of data values
The population variance is denoted with σ2 and is calculated using the formula σ2=∑(xi–μ)2/[N]. In this formula, xi represents the individual data values, μ is the population mean and N is the number of data values.

The population variance formula
- σ2 = the population variance
- xi = the individual data values
- µ = the population mean
- N = the number of data values in the sample
The formula can be explained in words as:
- Subtract the mean from each data value
- Square these answers
- Add these answers up
- Divide by the number of data values
Variance of a Discrete Random Variable
To calculate the variance of a discrete random variable, use the formula σ2=Σ(xi-µ)2pi. To use this formula, subtract the mean from each data value, square each result, multiply each of these values by the corresponding probability and then add each of the results.
Two formulae can be used to calculate the variance of a discrete random variable:
Formula 1 for variance of a discrete random variable
Formula 2 for variance of a discrete random variable

For example, calculate the variance of the discrete random variable with the following probability distribution:
| xi | 0 | 1 | 2 | 3 |
| pi | 0.25 | 0.15 | 0.5 | 0.1 |
Step 1. Calculate the mean
The mean, µ is found by multiplying each xi with its corresponding pi value and then adding the results together.
Step 2. Use the variance formula
This formula requires us to subtract the mean of 1.45 from each value, square each of these, multiply this by the corresponding probability and then add them up.
The variance is 0.9475.
Variance of a Continuous Random Variable
For a continuous random variable, the variance is calculated using the formula Var(X)=∫x2f(x)dx-µ2. The limits of integration are ‘a’ and ‘b’ where X is the continuous random variable with probability density function f(x) defined over the interval a≤x≤b.
Formula for the variance of a continuous random variable
is the probability density function
- The mean or
For example, find the variance of the continuous random variable X defined by the probability density function over the interval
.
Firstly, the mean is calculated using .
which simplifies to
.
Performing the integration, and evaluating this, we obtain
.
Now we substitute this into the variance equation so that becomes
.
Simplifying, we obtain .
Performing the integral, we obtain .
Evaluating this, and
.
Variance of a Binomial Distribution
The variance of a binomial distribution is calculated by σ2=np(1-p) where n is the number of trials and p is the probability of success.
Variance formula for a binomial distribution
For example, a fair dice is rolled 12 times. Let X be the number of fives rolled. Calculate the variance of X.
- n = 12
- p = 1/6
- (1-p) = 5/6
Therefore
Variance of a Bernoulli Random Variable
The variance of a Bernoulli random variable is given by σ2=p(1-p) where p is the probability of success.
Variance formula for a Bernoulli random variable
For example, a spinner containing 6 red and 4 blue sections is spun. Let X = 1 is the spinner lands on a red and X = 0 if the spinner lands on a blue. Calculate the variance of X.
p is the probability of success. A success here is obtaining a red since this is where X = 1.
Therefore p = 6/10
How to Calculate Variance in Excel
To calculate sample variance on excel, use the function =VAR.S(). Type =VAR.S() in the cell you wish to use and in between the brackets type the cells containing the data.
For example, find the sample variance of 1, 4, 4, 6, 9, 12 as shown below.
We enter the data 1, 4, 4, 6, 9, 12 in the cells from A1 to A6.
In a different cell we type=VAR.S() and in between the brackets we type A1:A6 which means that it will consider all of the data values from A1 to A6.
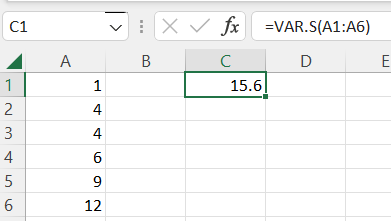
We obtain a sample variance of 15.6.
To calculate sample variance on excel, use the function =VAR.P(). Type =VAR.S() in the cell you wish to use and in between the brackets type the cells containing the data.
For example, find the population variance of 1, 4, 4, 6, 9, 12 as shown below.
We enter the data 1, 4, 4, 6, 9, 12 in the cells from A1 to A6.
In a different cell we type=VAR.P() and in between the brackets we type A1:A6 which means that it will consider all of the data values from A1 to A6.

We obtain a population variance of 13.0.
How to Calculate Variance on a Ti-84
To calculate the variance on a Ti-84:
- Press STAT and select 1: Edit from the list.
- Enter the data in List 1.
- Press STAT and select 1: 1-Var Stats from the CALC menu.
- Ensure the List is set to L1 and select calculate.
- Square the values of sx (sample) or σx (population).
Calculate the variance of the following data using a Ti-85 Texas Instruments Calculator
Data set: 1, 4, 4, 6, 9, 12
The population variance is 13.0.
The sample variance is 15.6.
Step 1. Press STAT and select 1: Edit from the list

Step 2. Enter the data in List 1
The data is entered in the first column L1.

Step 3. Press STAT and select 1: 1-Var Stats from the CALC menu
We press STAT and use the right arrow to scroll across to the CALC list.
Press 1 to select the 1-Var Stats option.

Step 4. Ensure the List is set to L1 and select calculate
On the screen below, ensure that List is set to L1 and FreqList is left blank.
Scroll down to calculate and press enter.

Step 5. Square the values of sx (sample) or σx (population)
In the list below, Sx is the sample standard deviation and σx is the population standard deviation.
Square these values to obtain the sample variance and population variance respectively.
3.605552 = 13.0 and so, the population variance is 13.0.
3.949682 = 15.6 and so, the sample variance is 15.6.

How to Calculate Variance on a Casio fx-CG50 Calculator
To calculate variance on a Casio fx-CG50:
- Click on menu and select statistics.
- Enter the data in List 1.
- Press F2 to select the CALC option.
- Press F1 to select the 1-VAR option.
- Square the values of sx (sample) or σx (population).
Calculate the variance of the following data using a Casio fx-CG50
Data set: 1, 4, 4, 6, 9, 12
The population variance is 13.0.
The sample variance is 15.6.
Step 1. Click on menu and select statistics
The statistics option is shown below.

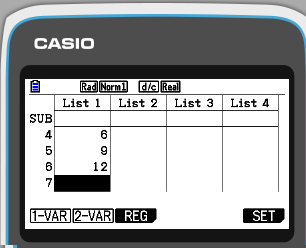
Step 2. Enter the data in List 1
The data list of 1, 4, 4, 6, 9, 12 is entered vertically in List 1 as shown below.
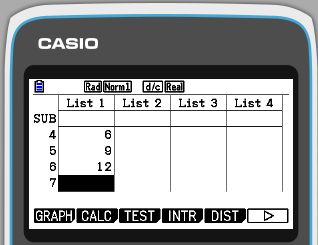
Step 3. Press F2 to select the CALC option
The F2 button at the top is directly below the CALC option as shown on the screen above.
The F1 button is directly below the 1-VAR option as shown on the screen above.
Step 4. Square the values of sx or σx
sx is the sample standard deviation and σx is the population standard deviation.
Both values appear in the list below.
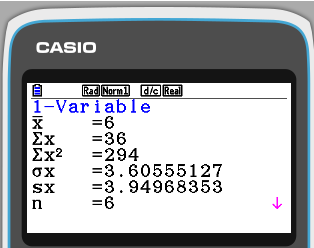
To obtain the variance from the standard deviation, square the standard deviation.
3.605552 = 13.0 and so, the population variance is 13.0.
3.949682 = 15.6 and so, the sample variance is 15.6.