Video Lesson: Sketching the Derivative Graph of a Function
What is the Graph of the Derivative Function?
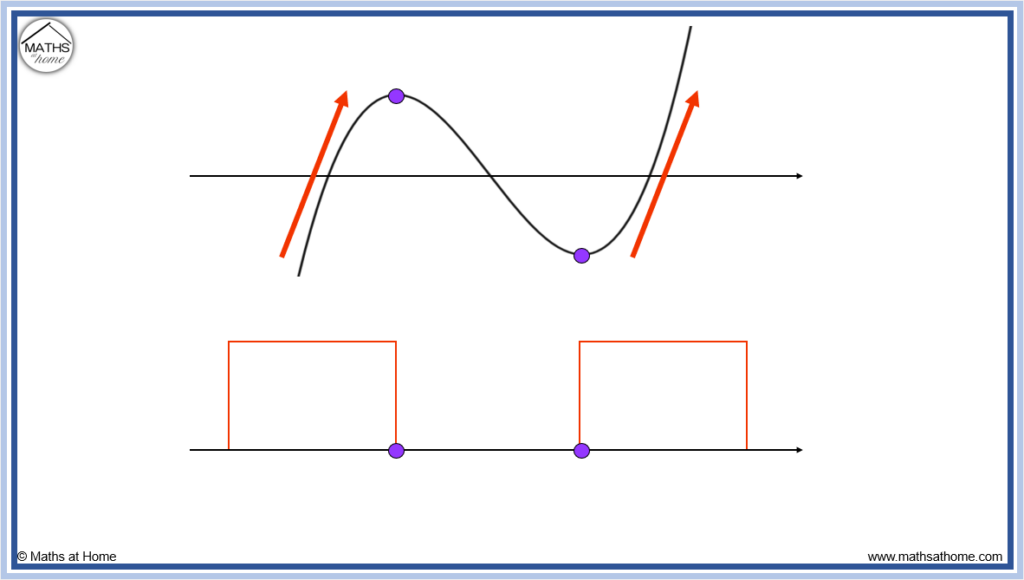
The derivative is the value of the gradient of the original function. The y coordinates at each point on the derivative function show the value of the gradient at the corresponding point on the original function.
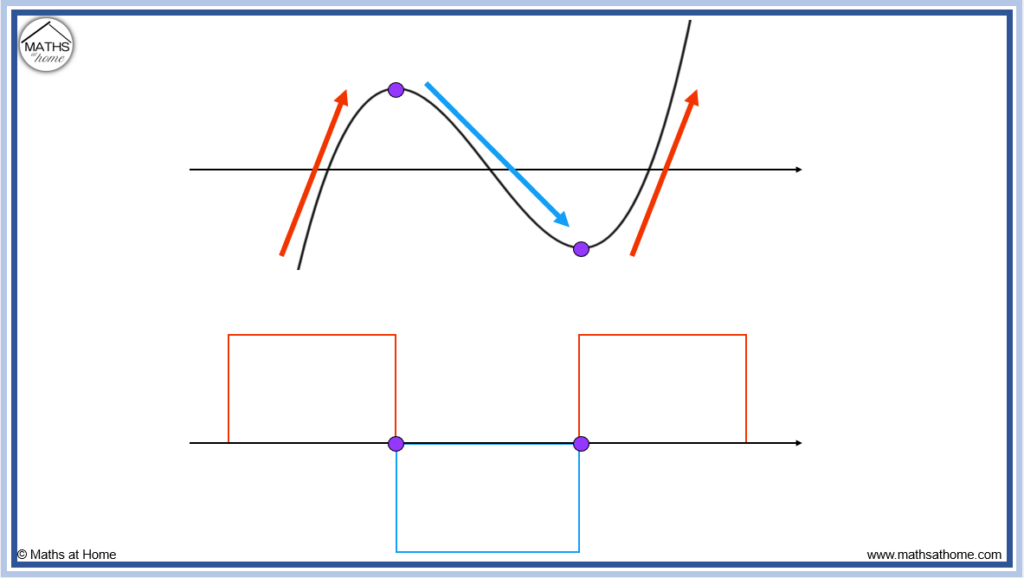
For example, the blue arrow shows where the gradient of the original function is negative. Here the graph is going downwards from left to right.
Therefore the derivative function is negative here, with the derivative function shown below the axis.
The red arrow shows where the gradient is positive. Here the graph is going upwards from left to right.
Therefore the derivative function is positive here with the derivative function shown above the axis.
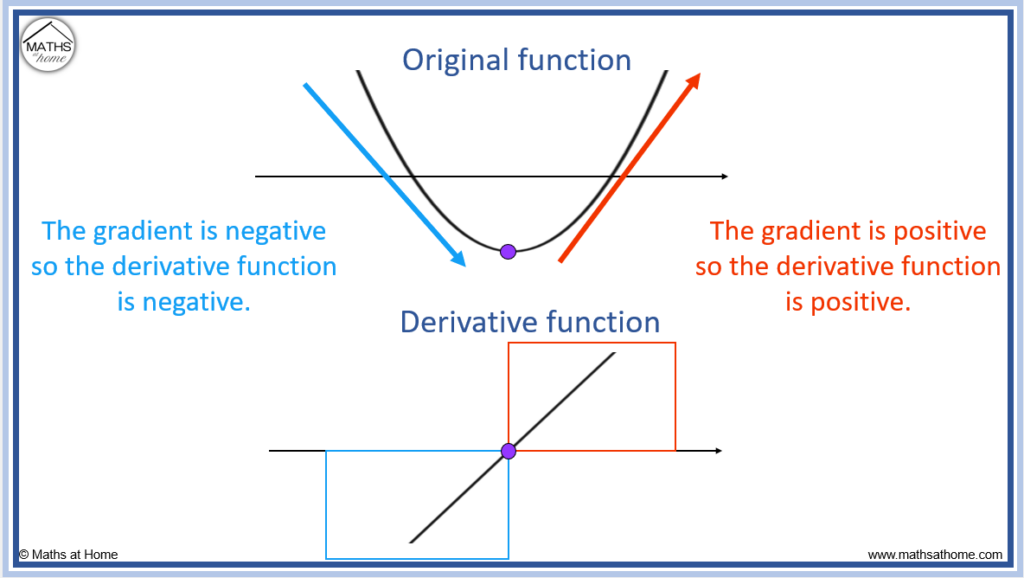
The purple dot shows the turning point on the original function. This is where the gradient of the graph changes from negative to positive. The gradient is zero at this point.
Therefore the corresponding purple dot on the derivative function is on the x-axis as this shows that the gradient is zero.
Summary of the First Derivative
The first derivative is the gradient.
- Where the gradient is positive,
and is above the x-axis
- Where the gradient is negative,
and is below the x-axis
- Where the gradient is equal to zero,
and is on the x-axis
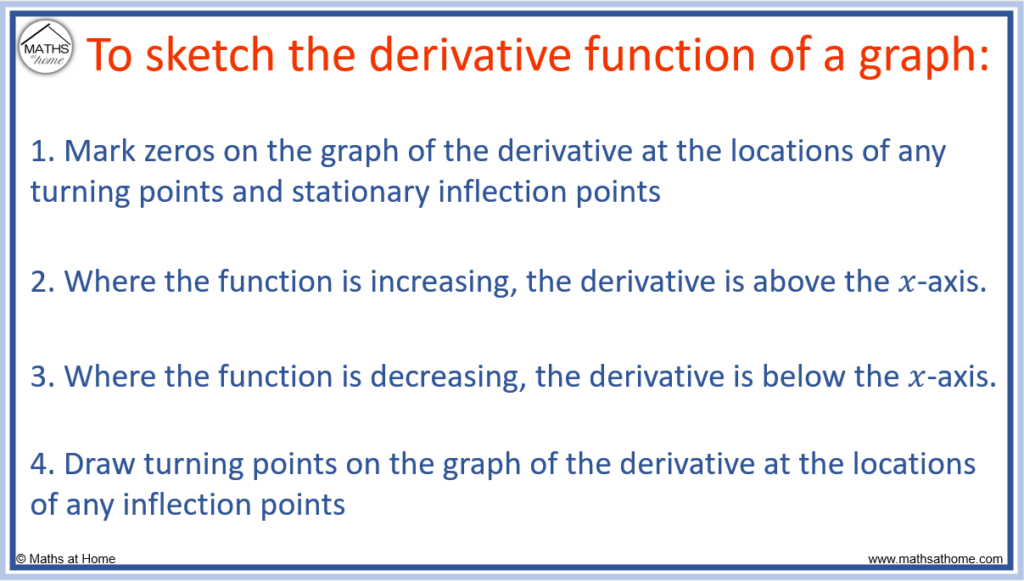
How to Sketch the Derivative of a Function
To sketch the derivative graph of a function:- Mark zeros at the locations of any turning points or stationary inflection points.
- Draw the derivative graph above the x-axis where the function is increasing.
- Draw the derivative graph below the x-axis where the function is decreasing.
- Draw turning points at the location of any inflection points.
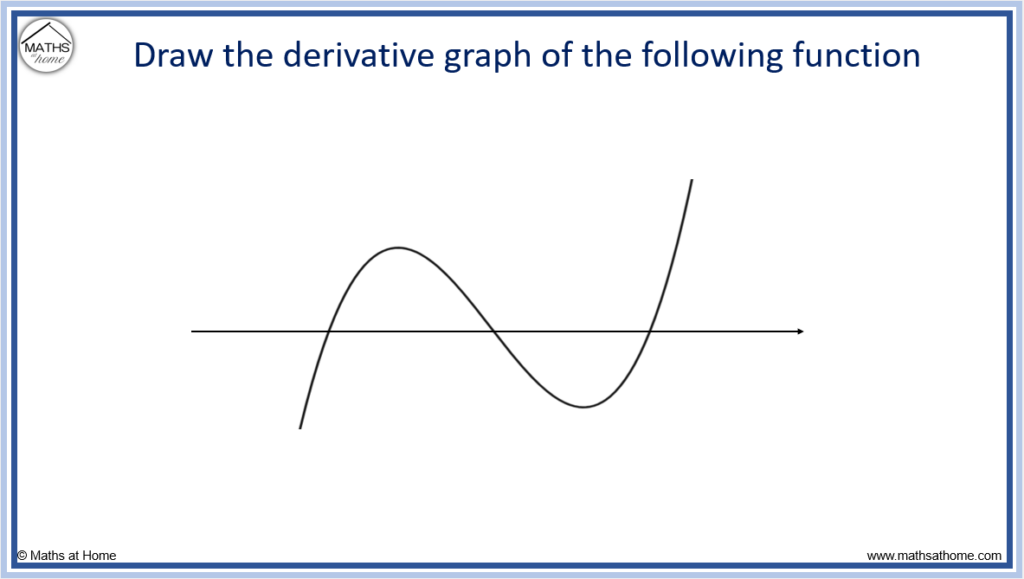
For example, sketch the derivative of the graph shown below.
Step 1. Mark zeros at the locations of any turning points or stationary inflection points
Turning points are where the graph turns around. There are two turning points on the graph shown below.
We mark zeros at the same locations on our derivative graph.
Zeros are points that are on the x-axis.
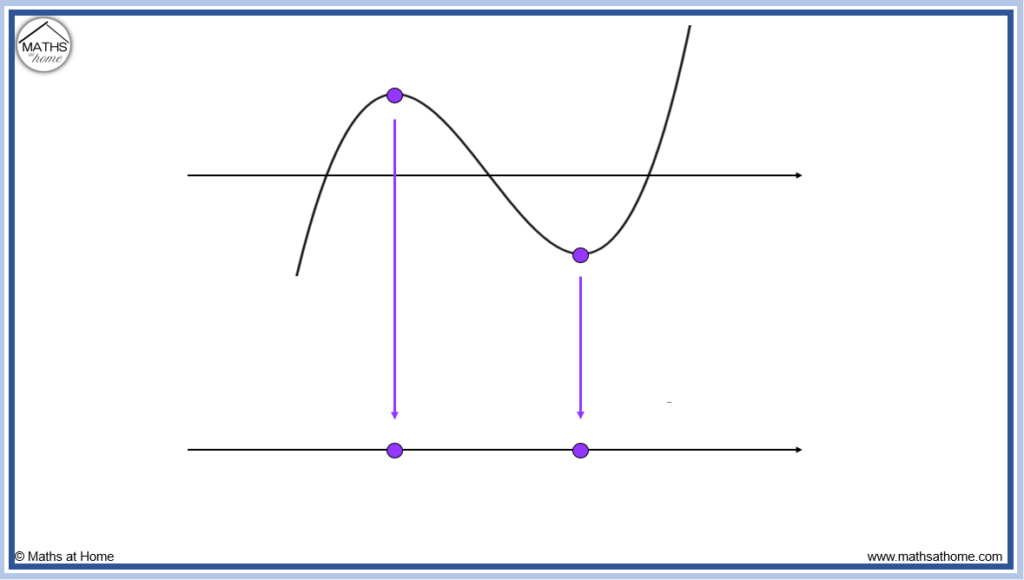
The reason for this is that the gradient of a graph is zero at the turning points or stationary points of inflection. Therefore the value of the derivative is zero at these locations. Therefore the graph of the derivative has zeros at these locations.
Step 2. Draw the derivative graph above the x-axis where the function is increasing
A function is increasing if it is going up from left to right. It is where the graph has a positive gradient.
In the graph shown, the function is increasing on the left of the first turning point.
It is also increasing on the right of the second turning point.
Therefore, the derivative graph will be above the x-axis on the left of the first zero and on the right of the second zero as shown below.
This is because the derivative graph describes the gradient of the original function.
When a function is increasing, it has a positive gradient.
If the gradient of the function is positive, the derivative is positive. Therefore the derivative is above the x-axis in these regions.
Step 3. Draw the derivative graph below the x-axis where the function is decreasing
A function is decreasing when it goes down from left to right. It is where the graph has a negative gradient.
The graph is decreasing between the two turning points. Therefore the derivative graph is below the x-axis between its two zeros.
This is because the gradient is negative between these two points. If the gradient is negative, it must be below the x-axis.
Step 4. Draw turning points at the location of any inflection points
There is one inflection point on the original graph as shown by the pink dot below. This corresponds to the position of the turning point on the derivative graph.
The derivative graph can now be drawn by connecting a curved line through the boxed regions shown, passing through both zeros and the turning point.
We do not know how high the turning point is and therefore this a sensible guess is made in the sketch.
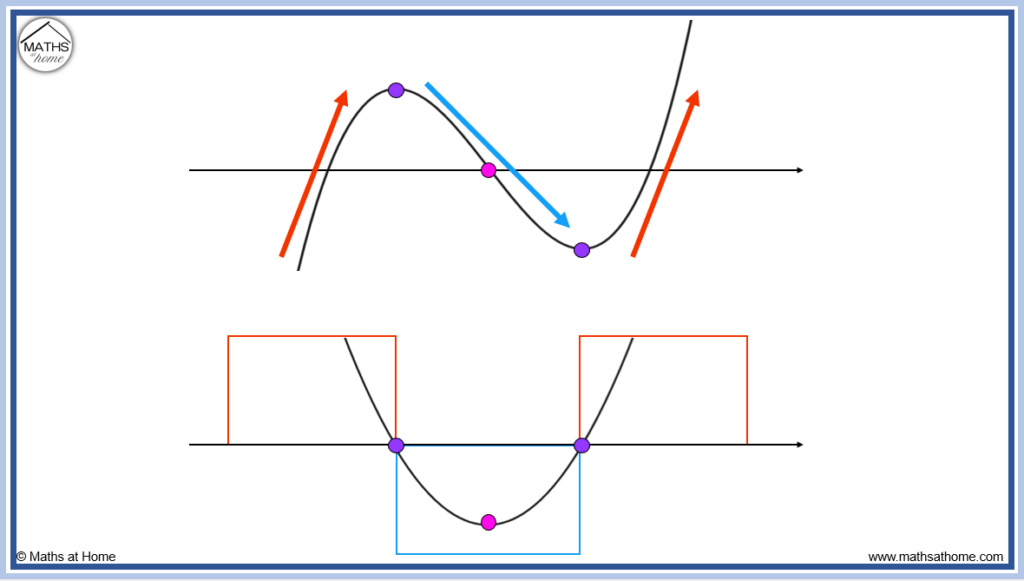
The original function is a cubic function with two turning points.
The graph of the derivative is a quadratic function with one turning point.
Sketching the Derivative from a Graph: Examples
The following functions have the derivatives of the form listed below:
| Function | Graph of its Derivative |
| Linear | Horizontal Line |
| Quadratic | Linear |
| Cubic | Quadratic |
| Quartic | Cubic |
| Exponential | Exponential |
| Logarithmic | Rational |
| Sine | Cosine |
| Cosine | Sine |
The graph of the derivative contains the same number of turning points as the number of inflection points on the original function.
In typical polynomial functions, the derivative will often contain one less turning point than the original function.

Knowing the form of the graph we are expecting can be helpful when making the sketch of the derivative function.
Sketch the Derivative of a Linear Function
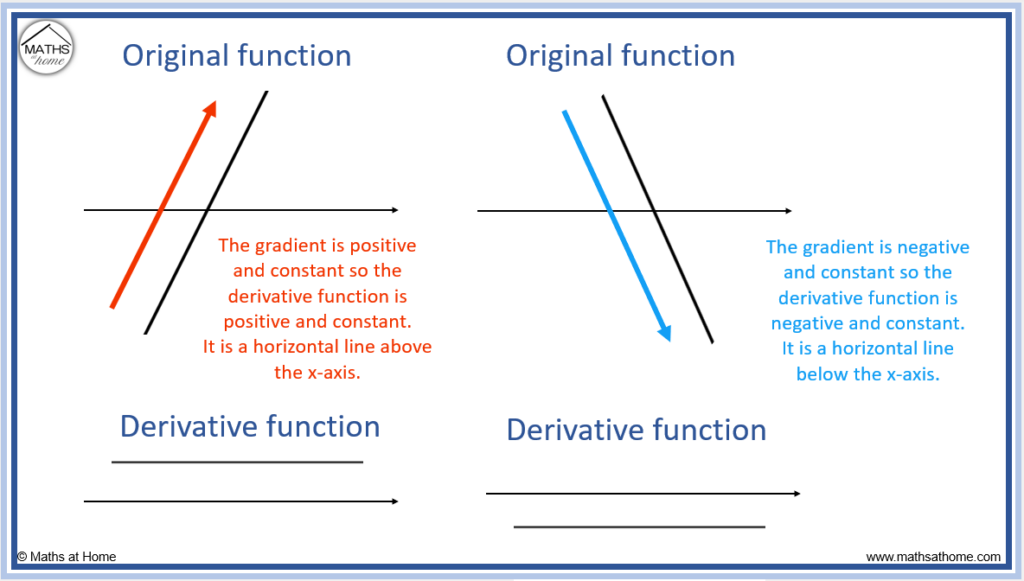
The graph of the derivative of a linear function is simply a horizontal line at a height equal to the gradient of the linear function. If the linear function has a positive gradient, its derivative graph is above the x-axis. If the linear function has a negative gradient, its derivative graph is below the x-axis.
Sketch the Derivative of a Quadratic Function
The graph of the derivative of a quadratic graph is a straight line that crosses the x-axis at the same point as the turning point of the quadratic. If the quadratic is concave up, its derivative is a linear function with a positive gradient. If the quadratic is concave down, its derivative is a linear function with a negative gradient.
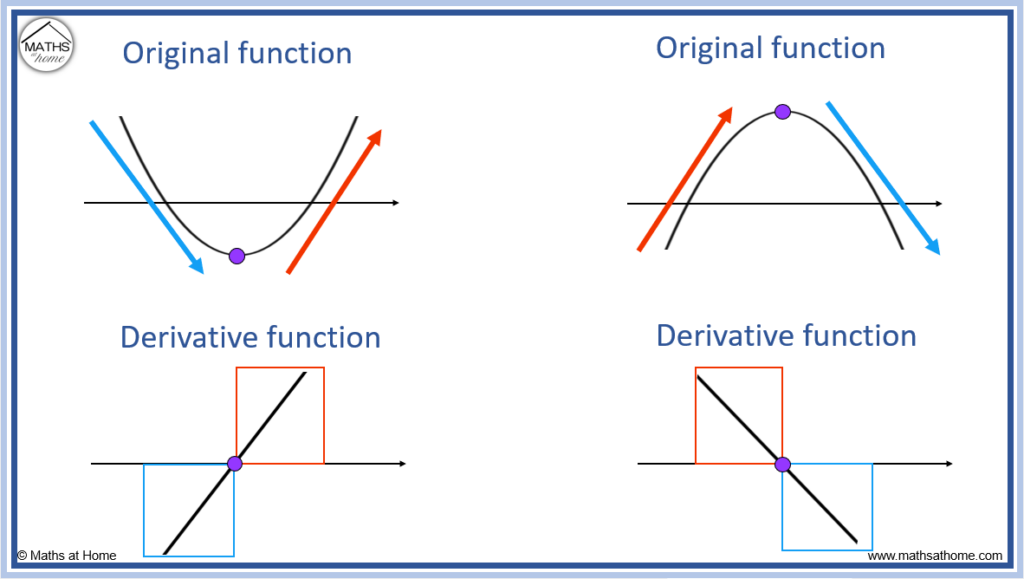
A concave-up quadratic is shown on the left of the image. It is a parabola shape.
We can see that the gradient is negative to the left of the minimum point and positive to the right of the minimum point. Therefore the derivative function is negative on the left (below the x-axis) and then positive on the right (above the x-axis). The minimum point is in the same position as where the derivative function crosses the x-axis.
A concave down quadratic is shown on the right of the image. It is an upside-down parabola shape.
We can see that the gradient is positive to the left of the maximum point and then negative to the right of the maximum point. Therefore the derivative function is positive on the left (above the x-axis) and then negative on the right (below the x-axis). The maximum point is in line with where the derivative function crosses the x-axis.
Sketch the Derivative of a Cubic Function
The derivative of a cubic function is a quadratic function. The graph of the derivative is a parabola with its turning point at the location of the inflection point of the cubic. The zeros of the parabola are at the location of the turning point of the cubic.
Cubic graphs can either have a maximum point first and then a minimum point or they can have a minimum point first and then a maximum point.
The derivative graphs of both types of cubic graph are shown below.
The x-axis intercepts (zeros) of the derivative graphs are in the same location as the turning points of the cubic graphs. This are shown by the purple dots in the image below.

In the first instance, the cubic graph starts as an increasing function, then it decreases between the maximum and minimum points and finally increases again.
Therefore the graph of its derivative starts positive then is negative between the zeros before becoming positive again. The derivative graph is a concave up parabola with a minimum point that is in line with the location of the inflection point of the original cubic function.
In the second instance, the cubic graph starts as a decreasing function, then it increases between the minimum and maximum points before finally decreasing again.
The graph of its derivative starts negative, is positive between the two zeros before becoming negative again. It is a concave down parabola with a maximum point that is in line with the location of the inflection point of the original cubic function.
Sketch the Derivative of Exponential Functions
The derivative graph of an exponential function is another exponential function. The graph of the derivative of ex is the same as the graph of ex. Other exponential functions have derivative graphs which are the same as the original function but are stretched in the vertical direction.
The image below shows the derivative graph for functions of the form .
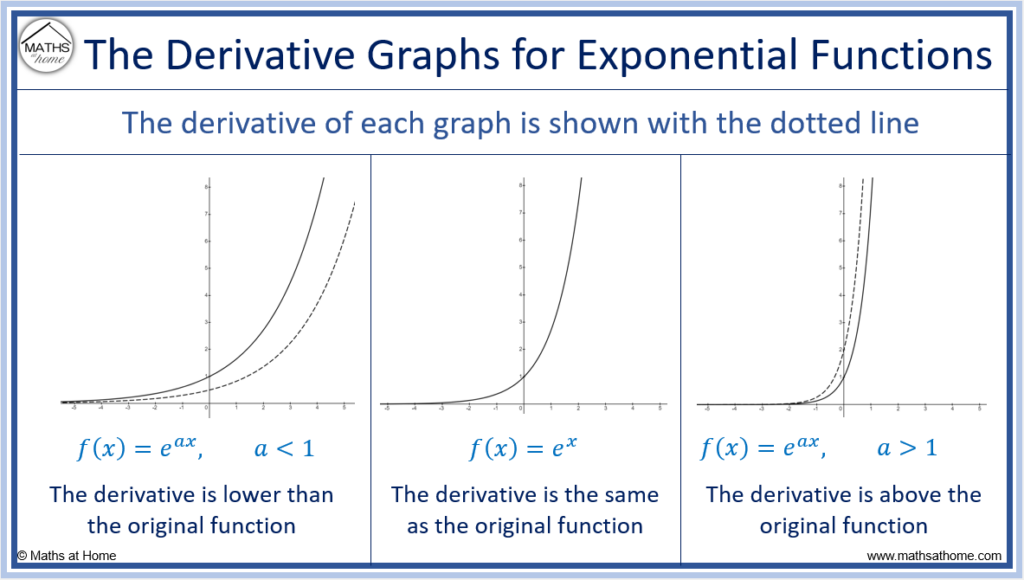
For the function , the graph of the derivative is identical to
.
This is because holds the property that
. The derivative is identical to the original function.
For functions of the form , the derivative is given by
.
Therefore the original function is stretched vertically by the value of ‘a’.
Therefore for values of ‘a’ larger than 1, the derivative function is stretched vertically and is shown above the original function.
For values of ‘a’ less than 1, the derivative function is ‘squashed’ vertically and is shown below the original function.
How to Sketch the Second Derivative
The second derivative graph has zeros wherever there is an inflection point on the original function. The second derivative is positive wherever the original function is concave up and it is negative where the original function is concave down.
The second derivative is a measure of curvature. The curvature of the original graph determines the values of the second derivative graph.
Where the curvature of is concave up,
.
Where the curvature of is concave down,
.
At points of inflection, .
To sketch the second derivative graph from a given graph use these steps:
- At the location of any inflection points, mark zeros on the second derivative sketch
- Wherever the curvature is concave-up, the second derivative is above the x-axis in this region
- Wherever the curvature is concave-down, the second derivative is below the x-axis in the region
Here is an example of sketching the graph of the second derivative when given the graph of the original function
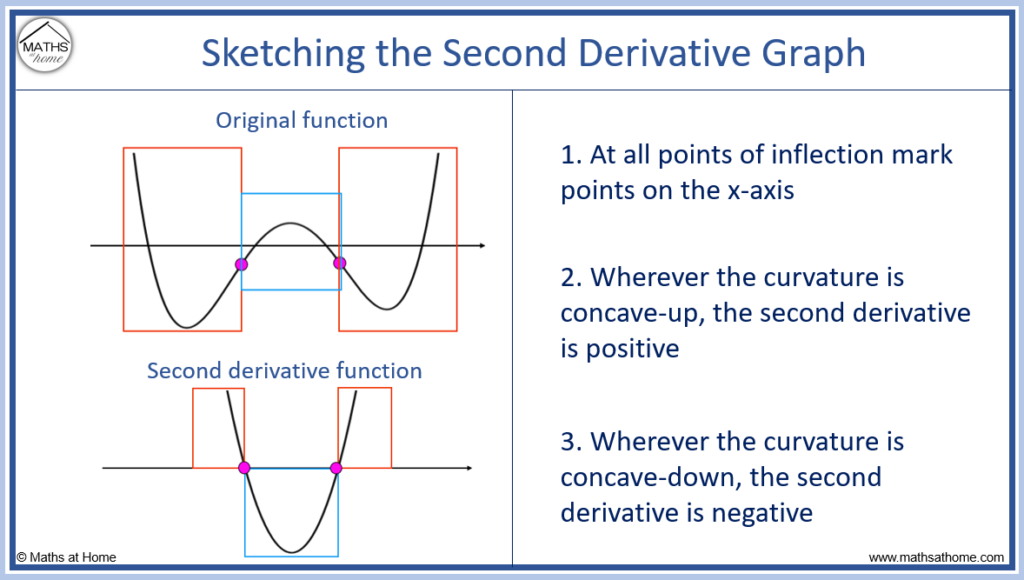
Step 1. At the location of any inflection points, mark zeros on the second derivative sketch
Inflection points are found where the curvature of the graph changes direction.
The two inflection points are shown with pink dots on the image above.
These two inflection points correspond to two x-axis intercepts (zeros) on the graph of the second derivative.
Step 2. Wherever the curvature is concave-up, the second derivative is above the x-axis in this region
The regions where the original graph is concave-up are shown inside red boxes on the image above. That is, to the left of the first inflection point and to the right of the second inflection point.
The graph of the second derivative is positive in these regions.
Therefore, the second derivative is above the x-axis on the left of the first inflection point and it is below the x-axis on the right of the second inflection point.
Step 3. Wherever the curvature is concave-down, the second derivative is below the x-axis in the region
The regions where the original graph is concave-down are shown inside blue boxes on the image above. That is, in between the two inflection points.
The graph of the second derivative is negative in this region. It is below the x-axis here.