Video Lesson: Average Rate of Change
What is the Average Rate of Change
The average rate of change is defined as the average change in a function per unit over a given interval. It is the gradient of the secant line connecting the endpoints of the interval. It describes how one quantity changes with respect to another.
The average rate of change is simply the gradient of the line connecting two points.
For example, consider the two points ‘a’ and ‘b’ below. Point ‘a’ has coordinates (0, 1) and point ‘b’ has coordinates (4, 3).
The average rate of change is simply the gradient of the red secant line shown in the diagram. We find the gradient of this line to find the average rate of change between the points.
The gradient is found by dividing the change in y-coordinates by the change in x-coordinates.
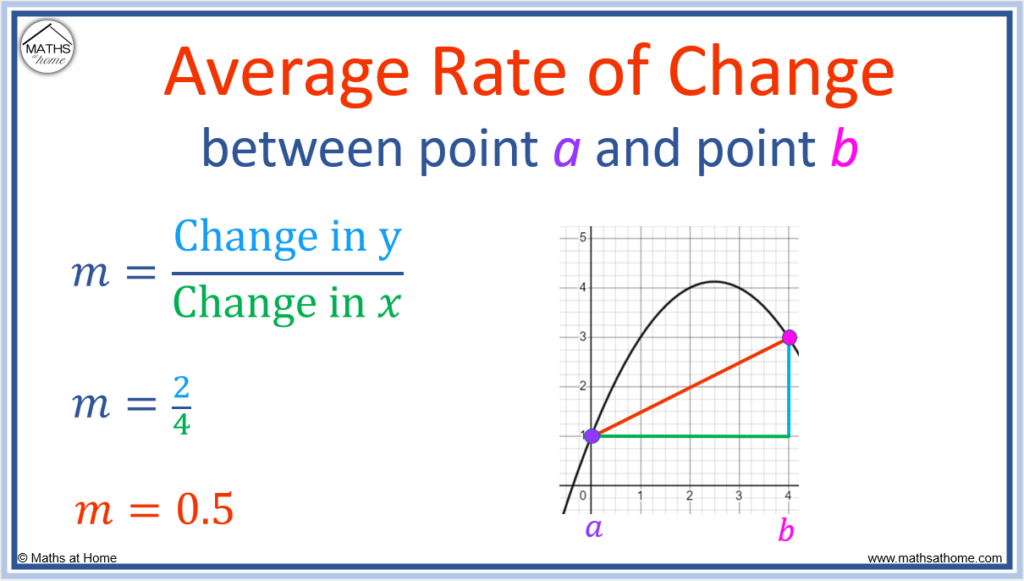
The change in y-coordinates between the 2 points is 2 and the change in x-coordinates between the 2 points is 4.
2 ÷ 4 = 0.5 and so, the average rate of change is 0.5.
The average rate of change is a concept used in calculus to measure the gradient between two points. As the two points are brought closer together, the gradient of the secant line connecting them approaches the gradient of the tangent at the first point.
In the example below, the gradient of the tangent to the curve at point ‘a’ is shown in green. It has a gradient of 2.
The average rate of change is shown by the secant line in red.
In the middle image, the gradient of the red secant line connecting points ‘a’ and ‘b’ is 0.5.
In the final image, the point ‘b’ is brought closer to point ‘a’. Here the gradient of the red secant line is now closer to the gradient of the green tangent line.
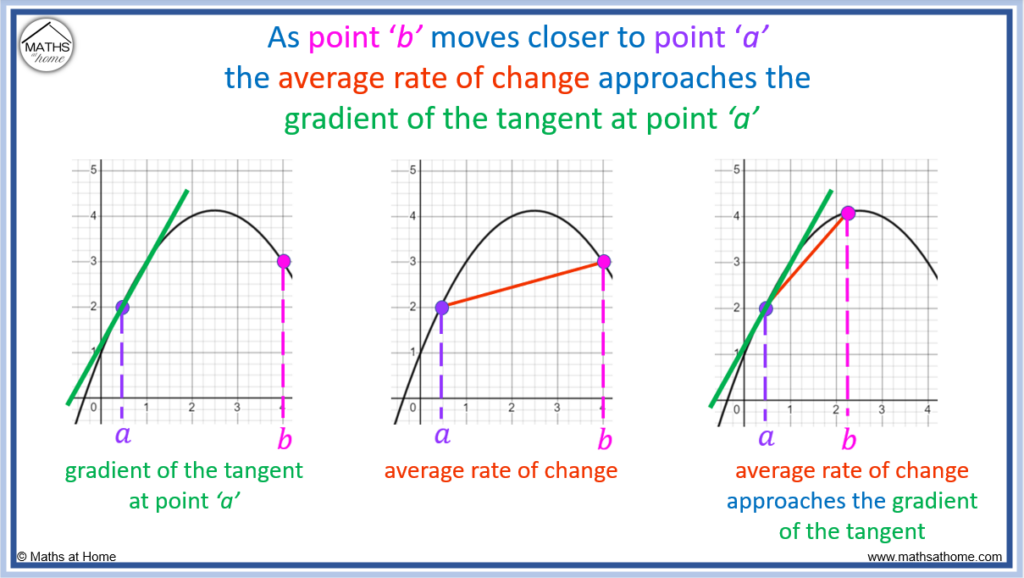
As the two points get closer and closer, the gradient of the red secant line approaches the gradient of the tangent at the first point.
Instantaneous and Average Rates of Change
There are two types of rate of change that can be shown on a graph: instantaneous rate of change and average rate of change.
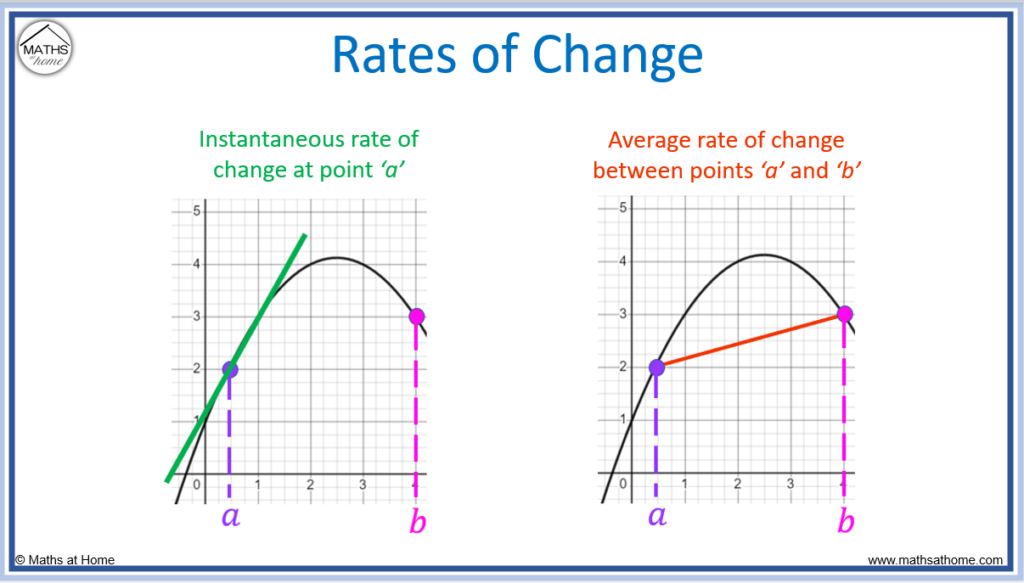
The instantaneous rate of change is equal to the gradient of the tangent to the curve at a point. This is shown by the green line in the image above.
The instantaneous rate of change can be calculated by drawing a tangent at a point and calculating its gradient. Alternatively it can be calculated by differentiating the equation of the curve and then substituting in the value of 𝑥 at that point.
The average rate of change is equal to the gradient of the secant connecting two points. This is shown by the red line in the image above.
How to Find the Average Rate of Change From a Graph
To find the average rate of change from a graph:
- Find the coordinates of the two endpoints of the interval.
- Calculate the rise between the two points.
- Calculate the run between the two points.
- The average rate of change is equal to the rise ÷ run.
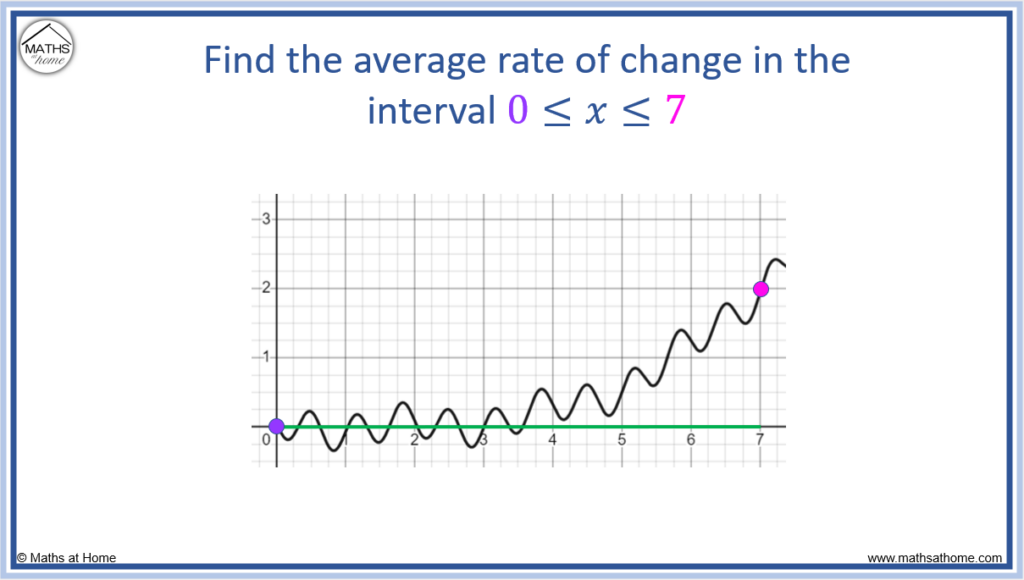
For example, find the average rate of change in the interval 0 ≤ 𝑥 ≤ 7 on the graph shown below.
The ends of the interval have been marked by two points.
Step 1. Find the coordinates of the two endpoints of the interval
The first coordinate is (0, 0).
The second coordinate is (7, 2)
Step 2. Calculate the rise between the two points
The rise is equal to the change in the y-coordinates between the two points.
We go from 0 to 2 and so, the rise is equal to 2.
Step 3. Calculate the run between the two points
The run is equal to the change in the x-coordinates between the two points.
We go from 0 to 7 and so, the run is equal to 7.

Step 4. The average rate of change is equal to the rise ÷ run
The rise is 2 and the run is 7.
Therefore, the average rate of change is equal to 2 ÷ 7.
Calculating this, this is approximately equal to 0.286.
Therefore the average rate of change between (0, 0) and (7, 2) is 0.286.
This means that for each 1 unit moved to the right, the graph increases by 0.286 on average in the vertical direction.
Understanding the Average Rate of Change
The average rate of change is 0.286 and it applies to the whole region of the interval from 0 to 7.
We can see in the image below that the red secant line is above the graph for almost the entire interval. Therefore it is not a good indication of the average rate of change at all points along the graph.
To be a more accurate average rate of change, it would be expected that the red secant line would follow the trend of the graph more closely.
The graph changes over the interval and to improve the accuracy, smaller intervals can be considered.
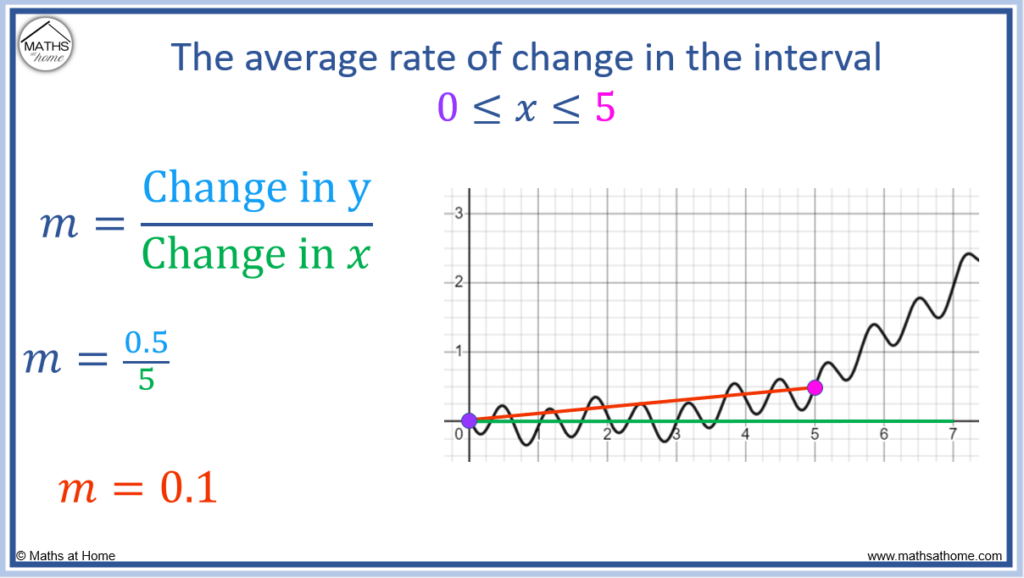
For example, we can find the average rate of change in the interval 0 ≤ 𝑥 ≤ 7.
Between these points, the rise is 0.5 and the run is 5.
0.5 ÷ 5 = 0.1 and therefore the average rate of change in this interval is 0.1.
This is a more accurate average rate of change for this section of the curve as the red secant line passes more closely through the middle of the curve.
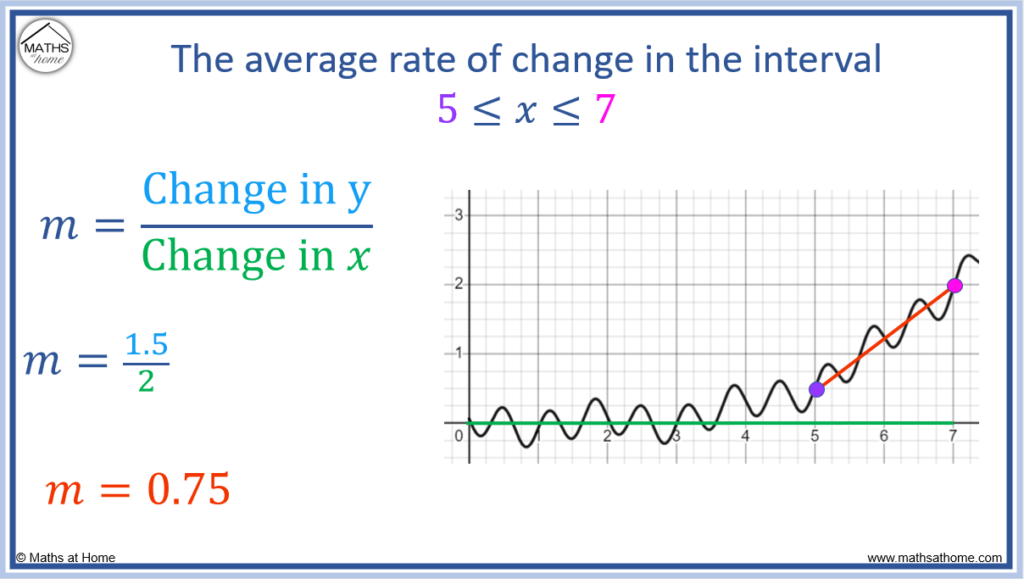
Now we can look at the average rate of change in the remaining section of the curve from 5 ≤ 𝑥 ≤ 7.
The rise is 1.5 and the run is 2.
1.5 ÷ 2 = 0.75 and so, the average rate of change in this interval is 0.75.
From 0 ≤ 𝑥 ≤ 5, the average rate of change is 0.1 and from 5 ≤ 𝑥 ≤ 7 the average rate of change is 0.75.
We can see that the graph increased much more rapidly from 5 to 7 compared to its steady rise from 0 to 5.
This is why the average rate of change over the entire interval from 0 to 7 is in the middle of these values at 0.286.
How to Find the Average Rate of Change
To find the average rate of change between two points, divide the change in y-coordinates by the change in x-coordinates over the interval.
For example, find the average rate of change of in the interval
.
The y-coordinates of each point are found by substituting the corresponding values of x into the equation of the function.
When , the y-coordinate is found by substituting
into
.
Making the substitution, and so, the y-coordinate of this first point is equal to 1.
When , the y-coordinate is found by substituting
into
.
Making the substitution, and so, the y-coordinate of this second point is equal to 4.
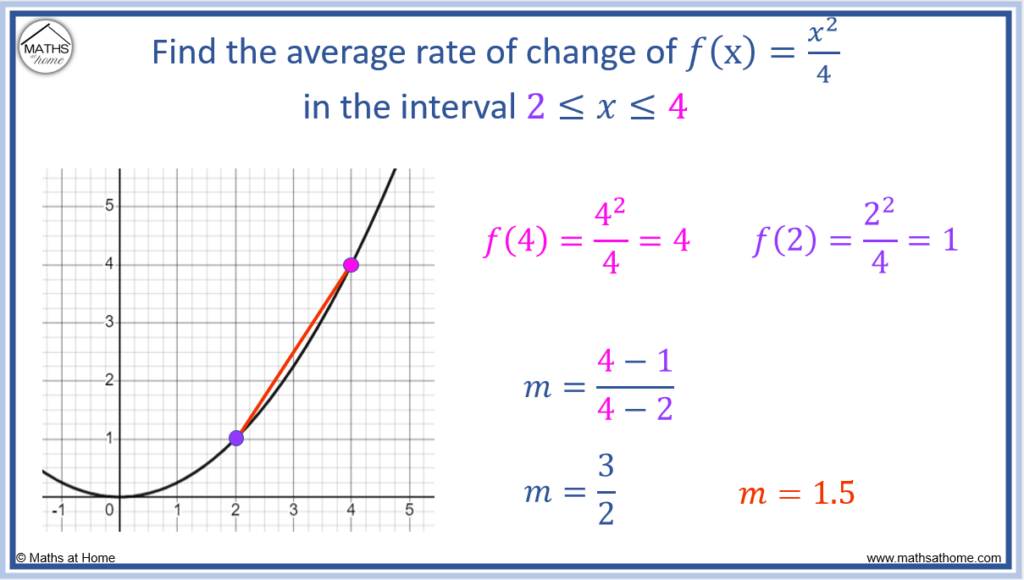
The average rate of change is found by dividing the change in the y-coordinates by the change in the x-coordinates.
The first point has an x-coordinate of 2 and a y-coordinate of 1.
The second point has an x-coordinate of 4 and a y-coordinate of 4.
The change in y-coordinates is therefore 4 – 1 = 3.
The change in x-coordinates is therefore 4 – 2= 2.
The average rate of change is 3 ÷2 = 1.5.
Average Rate of Change Formula
The average rate of change = [ f(b) – f(a) ]/[ b – a ]. This formula is used to calculate the average rate of change over the interval a≤𝑥≤b. f(a) is the value of the y-coordinate at point a and f(b) is the value of the y-coordinate at point b.
Average rate of change formula for the interval
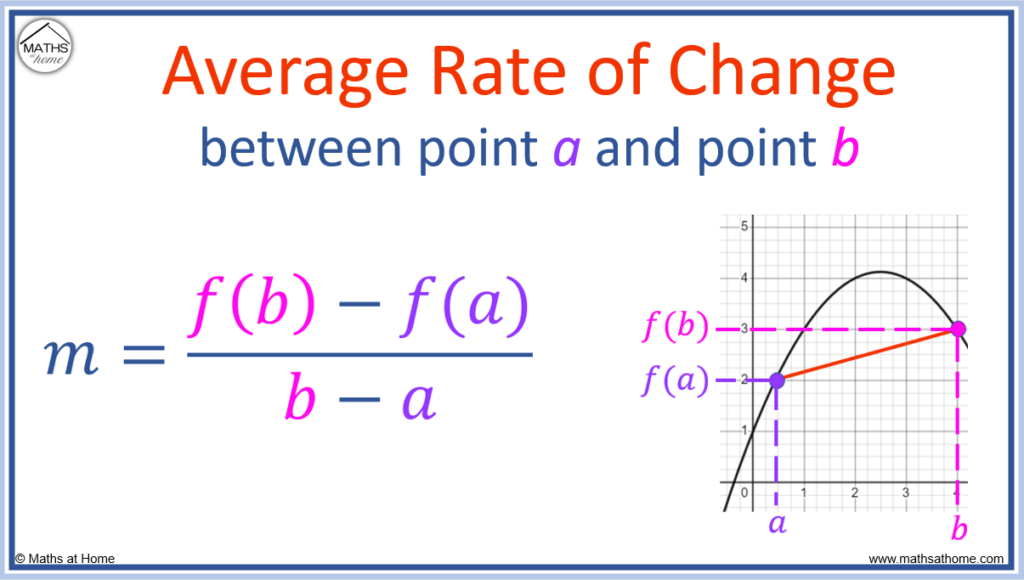
- ‘a’ is the x-coordinate of the first point
- f(a) is the y-coordinate of the first point
- ‘b’ is the x-coordinate of the second point
- f(b) is the y-coordinate of the second point
For example between the two points (0.5, 2) and (4, 3):
- ‘a’ = 0.5
- f(a) = 2
- ‘b’ = 4
- f(b) = 3
The average rate of change formula, becomes
.
Evaluating this formula which approximately equals 0.286.
Alternate ways of writing the average rate of change formula are:
Average Rate of Change From a Table
To find the average rate of change from a table of values:
- Find the change in y-coordinate values over the interval.
- Find the change in 𝑥-coordinate values over the interval.
- Divide the change in y-coordinate values by the change in the 𝑥-coordinate values.
For example, find the average rate of change in the interval from the table below.
Step 1. Find the change in the y-coordinate values over the interval
Over the interval from 𝑥 = 3 to 𝑥 = 8, the y-coordinates change from 0 to 5.
Therefore the change in the y-coordinates over this interval is 5.
Step 2. Find the change in 𝑥-coordinate values over the interval
From 𝑥 = 3 to 𝑥 = 8, this is a change of 5.
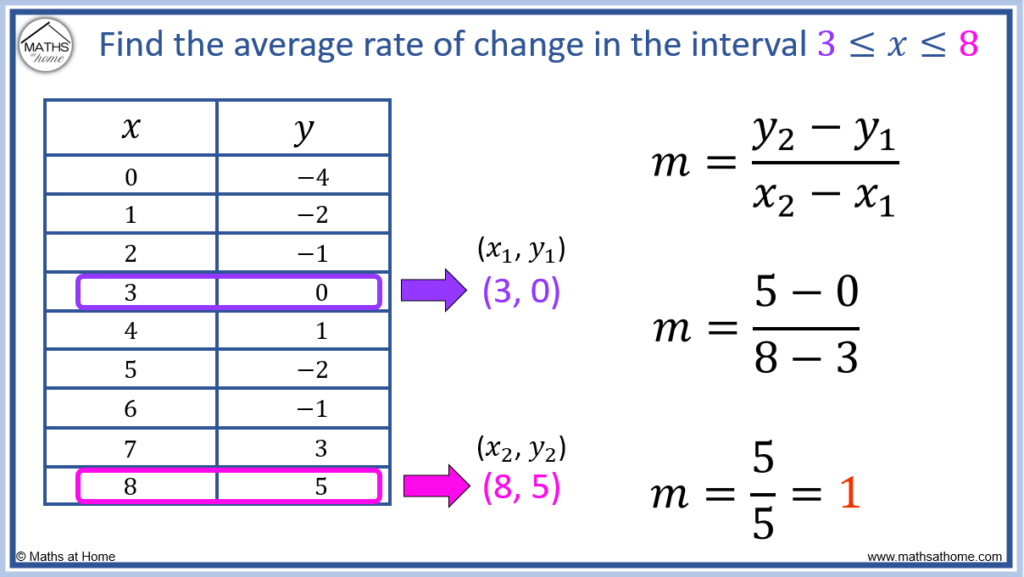
Step 3. Divide the change in the y-coordinate values by the change in the 𝑥-coordinate values
The change in y-coordinate values is 5.
The change in 𝑥-coordinate values is 5.
Dividing the change in y-coordinates by the change in the 𝑥 coordinates, 5 ÷ 5 = 1.
Therefore the average rate of change over this interval is 1.