Video Lesson: How to do Dominance Matrices
What are Dominance Matrices?
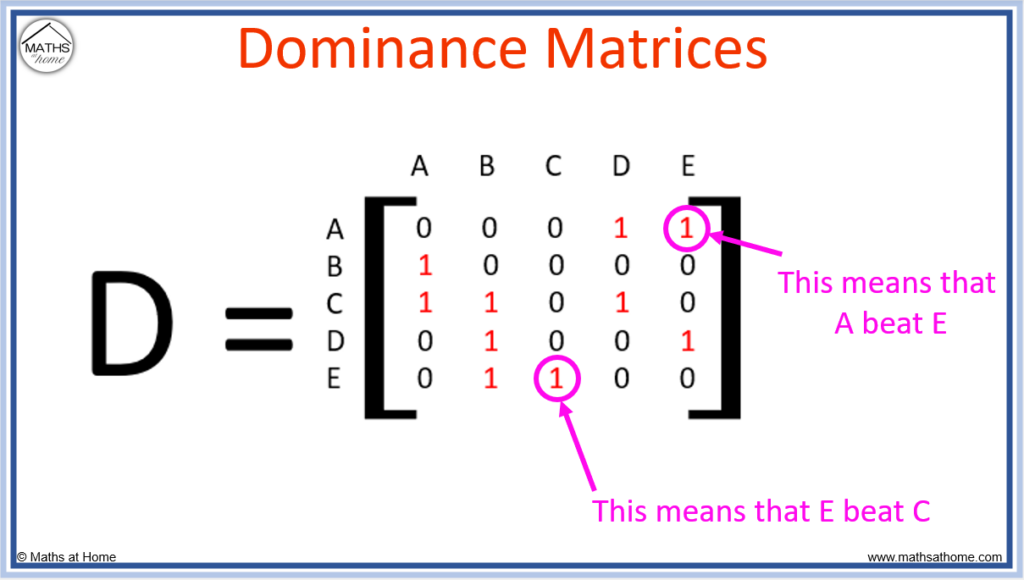
A dominance matrix is a numerical representation of which person or team has dominance over others within round-robin competitions. The value of 1 is written in the matrix if an entity has dominance over another and a 0 is written if they do not. Dominance matrices are used to make rankings by finding the sum of each row in the matrix.
Dominance matrices allow a given set of results to be represented numerically.
Typically, a set of results can be given as a list. Alternatively, a dominance network can be drawn to show the outcomes in a visual manner. Dominance matrices can be used to represent the results in a mathematical manner so that further calculations can be made.
Dominance Networks
To construct a dominance network:
- Draw and label nodes to represent each competitor.
- Draw arrows from the winner to the loser of each game.
For example, a network diagram is drawn to represent the following situation:
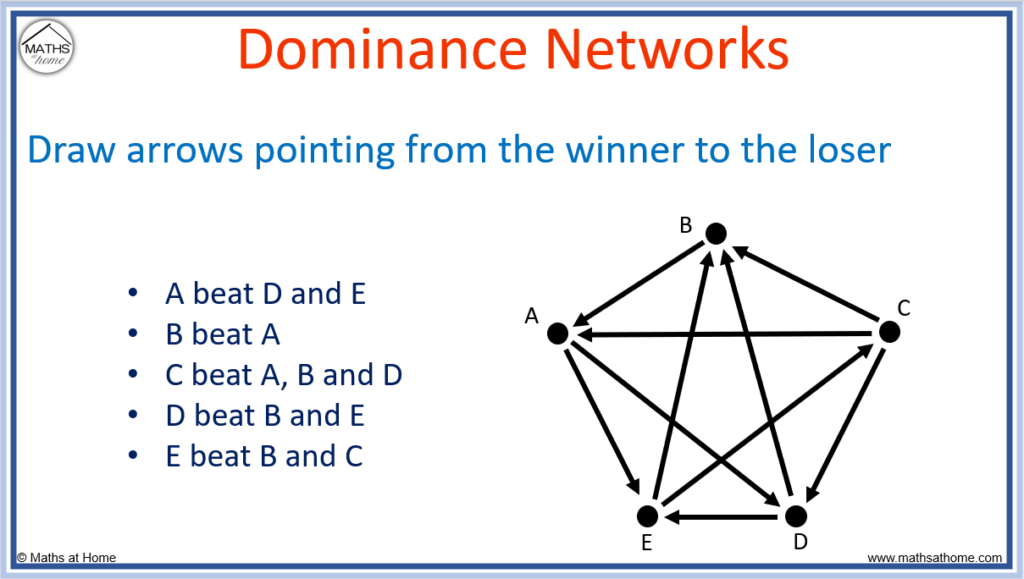
- A beat D and E
- B beat A
- C beat A, B and D
- D beat B and E
- E beat B and C
- Draw arrows from A to D and E
- Draw an arrow from B to A
- Draw arrows from C to A, B and D
- Draw arrows from D to B and E
- Draw arrows from E to B and C
Dominance Matrices
To make a dominance matrix:
- Label the columns and rows of the matrix in the same order.
- Consider each row as a different competitor.
- For each row, place a 1 below the columns of any competitor they beat.
- For each row, place a 0 below the other columns.
For example, a dominance matrix is drawn to represent the following situation:
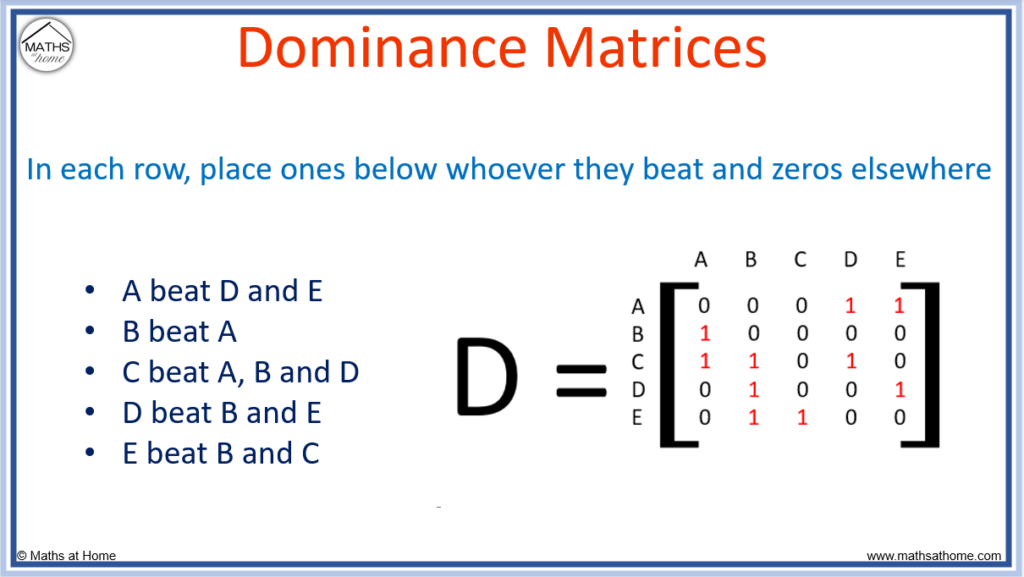
- A beat D and E
- B beat A
- C beat A, B and D
- D beat B and E
- E beat B and C
- In the A row: Place a 1 below D and E
- In the B row: Place a 1 below A
- In the C row: Place a 1 below A, B and D
- In the D row: Place a 1 below B and E
- In the E row: Place a 1 below B and C
Dominance matrices are used to rank competitors in round-robin competitions. This allows predictions to be made about future outcomes based on existing data. Dominance matrices are useful in predicting the outcomes of sporting competitions. They can also be used to rank anything in which there is a hierarchical structure.
To rank teams using a dominance matrix, add the numbers in each row to obtain the score for each team. The larger the score, the higher the rank.
Here are the rankings for the teams A to E:
| Team | Matrix Values | Score | Ranking |
| A | 0+0+0+1+1= | 2 | 2nd |
| B | 1+0+0+0+0= | 1 | 5th |
| C | 1+1+0+1+0= | 3 | 1st |
| D | 0+1+0+0+1= | 2 | 2nd |
| E | 0+1+1+0+0= | 2 | 2nd |
Team C is ranked 1st as it has the largest number of wins.
Teams A, D and E all rank joint 2nd as they has 2 wins each.
Team B ranked last as it has the least number of wins. We can rank team B as 5th as it is the final team out of 5. You could also rank it 3rd as it came after the teams that ranked 2nd. It just depends on how you choose to rank the teams.
Second Order Rankings
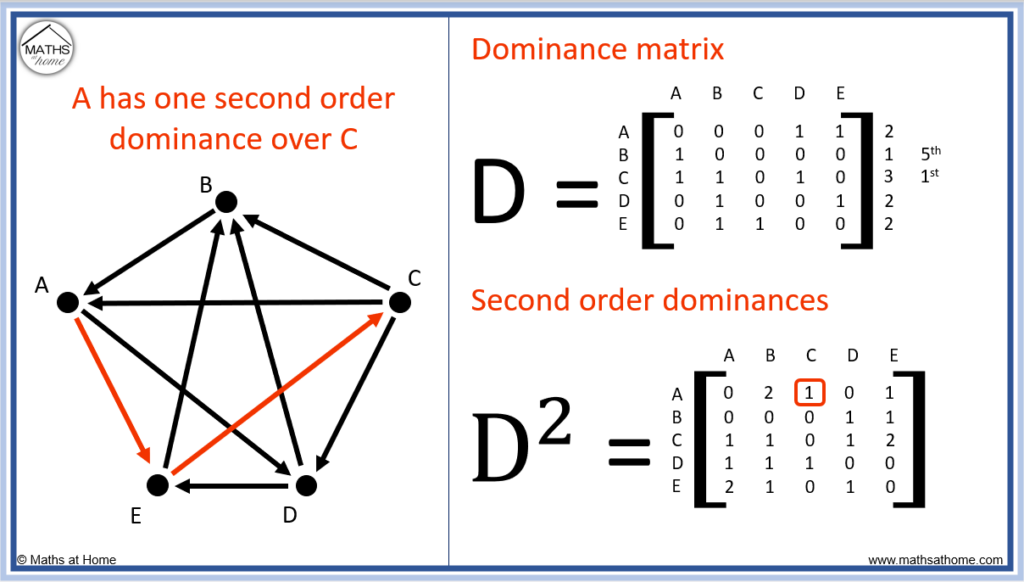
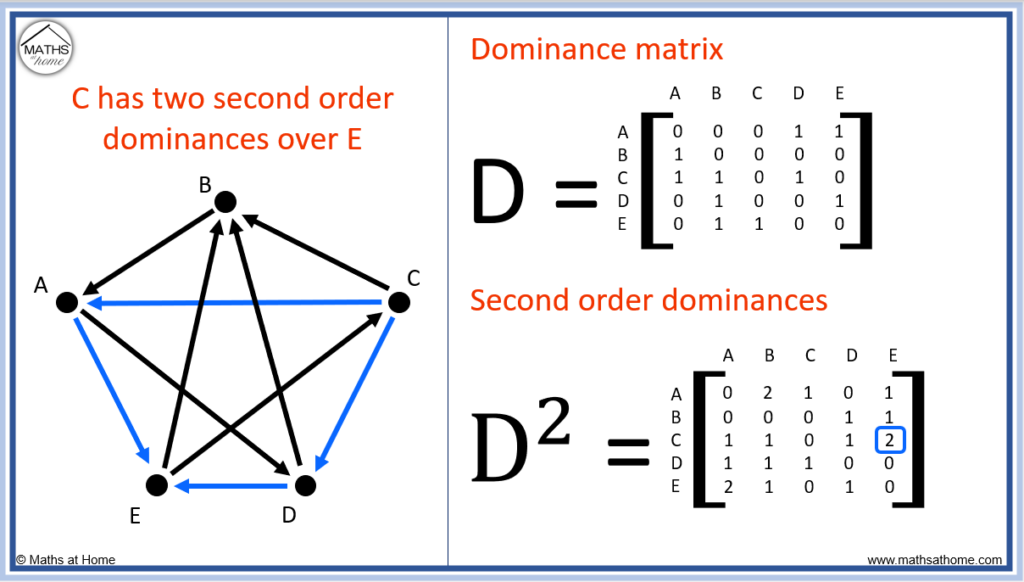
The second order dominances are found by squaring the dominance matrix to obtain D2. If team A beat team E who then beats team C, then A has a second order dominance over team C. The numbers in the D2 matrix show how many second order dominances a given team has over another.
The D2 matrix is found by squaring the D matrix. This can be easily done on a calculator.
For example, in the dominance network below it can be seen that team A beat team E, who then beat team C. This means that Team A has a second order dominance over team C.
The second order influence of team A over team C is shown with a 1 in the D2 matrix in the team A row and the team C column.
Team C has two different second order dominance rankings over team E.
- Team C beats team A who beats team E
- Team C beats team D who beats team E
Both of these two-step dominance paths are shown on the dominance network below. The two options are represented with a 2 in the D2 matrix below in the row of team C and the column of team E.
The second order dominances describe teams having dominance over teams because they beat other teams that went on to beat those teams. For example, if team C beats team A and team A then go on to beat team E, we can say that team C might be likely to beat team E. We say that team C have a second order dominance over team E.
Second order dominances found in the D2 are not as important as the actual results found in the dominance matrix D.
The dominance matrix D describes which teams beat one another. The second order dominance matrix D2 indicates results of teams that beat other teams. Therefore the dominance matrix D is often weighted more heavily than the second order dominance matrix D2. For example, the supremacy matrix is commonly used to rank teams. In this case, the second order influences have a coefficient of one half in order to reduce their impact in comparison with the direct dominance matrix ranking.
Supremacy Matrix
A supremacy matrix is used to rank teams or players in competitions. It is calculated using data collected in a dominance matrix. A common supremacy matrix calculation is S=D+1/2D2. Supremacy matrices can often give a more detailed breakdown of rankings and can be used to separate ties in the dominance matrix rankings.
Supremacy Matrix Calculation
Since
and
The supremacy matrix is calculated as
.
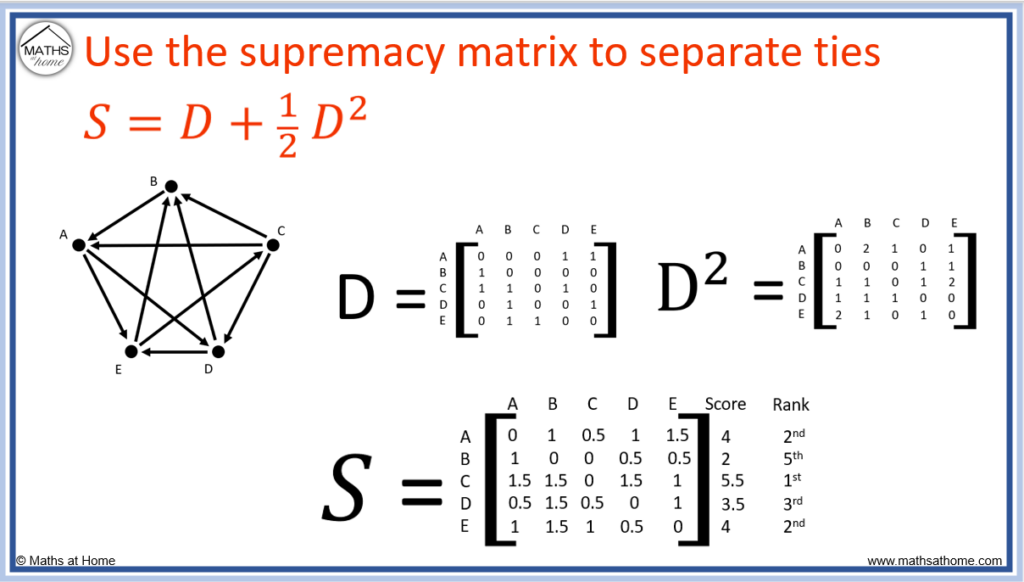
Rankings can be made using the supremacy matrix by adding the sums of each row.
We can see that compared to the dominance matrix rankings, we have managed to establish teams A and E as better than team D, whereas previously they were all tied.
Supremacy matrices have the advantage of separating ties found in a dominance matrix ranking. However, some ties may not be possible to separate.
How to Make Rankings Using Dominance Matrices
To make rankings using dominance matrices:
- Set up the dominance matrix by writing 1s below the columns which each team beat.
- Add up the numbers in each row of the matrix to obtain the score for each team.
- The teams with the highest score rank the highest.
- Calculate the supremacy matrix S=D+1/2D2 if needed to separate ties in rankings.
- Add up the rows of the supremacy matrix to find a more precise ranking.
For example, rank the sports players based on the following results:
- Alex beat Brian and Carl
- Brian beat Debbie
- Debbie beat Alex and Emma
- Emma beat Carl
- Carl beat Alex, Emma and Fred
- Fred beat Brian, Debbie and Emma
Firstly, a dominance matrix is formed with the player’s names in alphabetical order (A, B, C, D, E, F)
The row sum is found:
We can see that both Fred and Carl have 3 victories and would tie for 1st place. Alex and Debbie both have 2 points and would tie for the middle position with Brian and Emma both tied last.
We construct a supremacy matrix using the formula to try to separate the rankings.
A new row sum is found to be:
Therefore we have now fully separated the rankings so that:
- Carl = 6 points = 1st
- Fred = 5 points = 2nd
- Alex = 4 points = 3rd
- Debbie = 3.5 points = 4th
- Emma = 2.5 points = 5th
- Brian = 2 points = 6th
Making Predictions with Dominance Matrices
To make predictions with dominance matrices, rank the teams using the row sum of the dominance matrices. The higher ranked team is then predicted to beat the lower ranked teams.
For example, using the rankings:
Carl = 6 points = 1st
Fred = 5 points = 2nd
Alex = 4 points = 3rd
Debbie = 3.5 points = 4th
Emma = 2.5 points = 5th
Brian = 2 points = 6th
We would predict Carl to beat Debbie in a future match as Carl ranks 1st, whereas Debbie ranks 4th.
We would predict Emma to beat Brian in a future match as Emma is 5th and Brian is 6th.
The larger the gap in the point score, the greater the confidence there is in the prediction made.
For example, we would confidently say that Carl would be likely to beat Brian as there is a 4 point score difference between them and Carl ranks 1st and Brian ranks 6th.
We would also predict Carl to beat Fred but we would have less confidence in this outcome as there is only 1 point between them and 1 rank between them.
We would predict that Emma would beat Brian but we would be less confident in this as there is only a 0.5 point score difference between them.
Limitations of Dominance Matrices
The limitations of making predictions with dominance matrices are:- Only a small sample of results may have been used to create the rankings.
- Results from throughout a season should be taken to account for teams coming into and out of form.
- Teams may change from the point that the results were collected – injuries, change of coach, change of players etc.
- Individual tactics or playing styles are not accounted for in the data.
- Higher order influences may become less and less relevant.
- Game statistics such as win-margins and whether the game was played at home or away are not taken into account.
Dominance Matrices Investigation
Dominance matrices can be used in an investigation assignment to predict winners and rankings of sporting competitions. Round-robin competitions must be chosen in which each team plays each of the other teams. Existing data from sporting competitions can be sampled and used to predict the future outcomes and league rankings.
In investigations of this nature it can be interesting to trial different supremacy models such as those shown below:
It can be interesting to consider the impact of second order, third order (and even higher) influences to see which model predicts the league ladder rankings most accurately.
Improvements to the supremacy model could include:
- Changing the weighting of the values assigned in the original dominance matrix (e.g. 3 points for a win, 1 point for a draw, 0 points for a loss)
- Incorporating win-margins (e.g. 5 points if a team wins by a certain score line)
- Incorporating the results from over multiple seasons (e.g.
, where Dold would be results obtained from a previous year)
- Incorporating home/away factors (more points could be allocated for victories away from home as these can be more challenging)