Venn Diagrams with 3 Circles: Video Lesson
What is the Purpose of Venn Diagrams?
A Venn diagram is a type of graphical organizer which can be used to display similarities and differences between two or more sets. Circles are used to represent each set and any properties in common to both sets will be written in the overlap of the circles. Any property unique to a particular set is written in that circle alone.
For example, here is a Venn diagram comparing and contrasting dogs and cats.
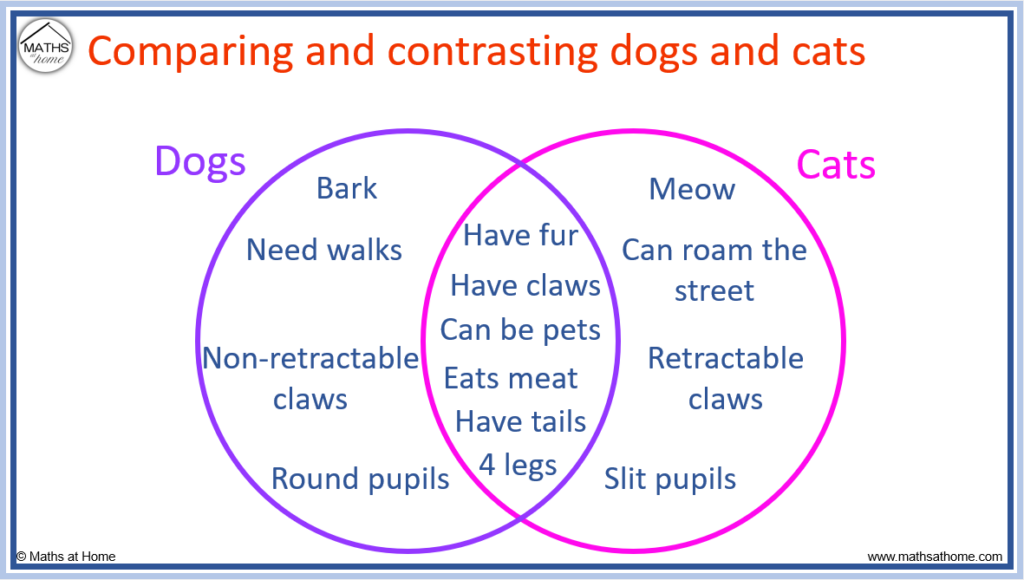
The Venn diagram shows the following information:
Only dogs:
- Bark
- Need walks
- Have non-retractable claws
- Have round pupils
Only cats:
- Meow
- Roam the street
- Have retractable claws
- Have slit pupils
Both dogs and cats:
- Have fur
- Have claws
- Can be pets
- Eat meat
- Have tails
- Have 4 legs
A Venn diagram with three circles is called a triple Venn diagram.
A Venn diagram with three circles is used to compare and contract three categories. Each circle represents a different category with the overlapping regions used to represent properties that are shared between the three categories.
For example, a triple Venn diagram with 3 circles is used to compare dogs, cats and birds.
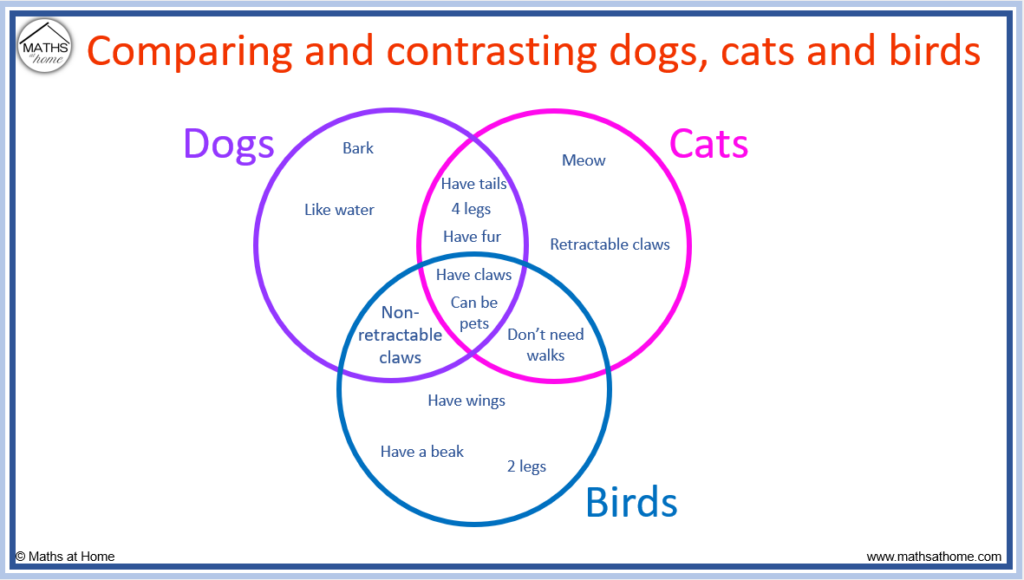
The Venn diagram shows the following information:
Dogs, cats and birds can all have claws and can also be pets.
Only dogs:
- Bark
- Like water
Only cats:
- Meow
- Have retractable claws
Only birds:
- Have wings
- Have a beak
- Have 2 legs
Only both dogs and cats:
- Have tails
- Have fur
- Have 4 legs
Only both dogs and birds:
- Have non-retractable claws
Only both cats and birds:
- Don’t need walks
How to Make a Venn Diagram with 3 Circles
To make a Venn diagram with 3 circles:- Write the number of items belonging to all three sets in the central overlapping region.
- Write the remaining number of items belonging each pair of the sets in their overlapping regions.
- Write the remaining number of items belonging to each individual set in the non-overlapping region of each circle.
Example 1:
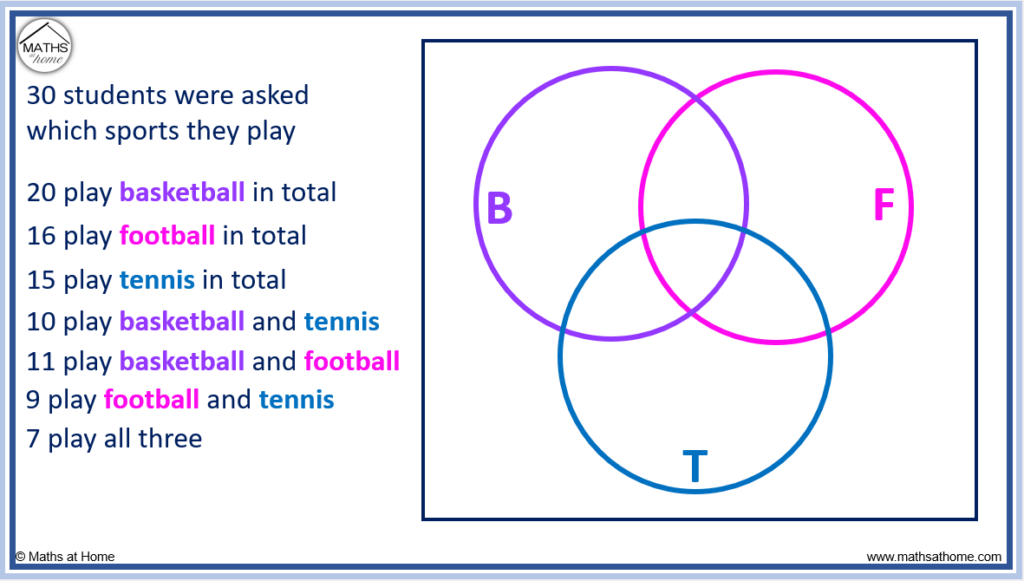
Make a Venn Diagram for the following situation:
30 students were asked which sports they play.
- 20 play basketball in total
- 16 play football in total
- 15 play tennis in total
- 10 play basketball and tennis
- 11 play basketball and football
- 9 play football and tennis
- 7 play all three
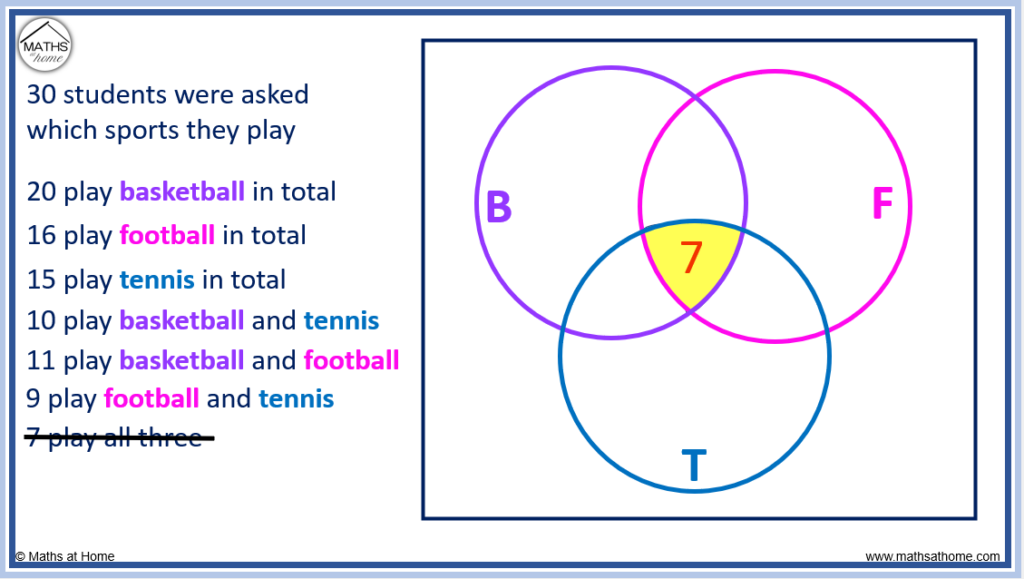
- Write the number of items belonging to all three sets in the central overlapping region
When making a Venn diagram, it is important to complete any overlapping regions first.
In this example, we start with the students that play all three sports. 7 students play all three sports.
The number 7 is placed in the overlap of all 3 circles. The shaded region shown is the overlapping area of all three circles.
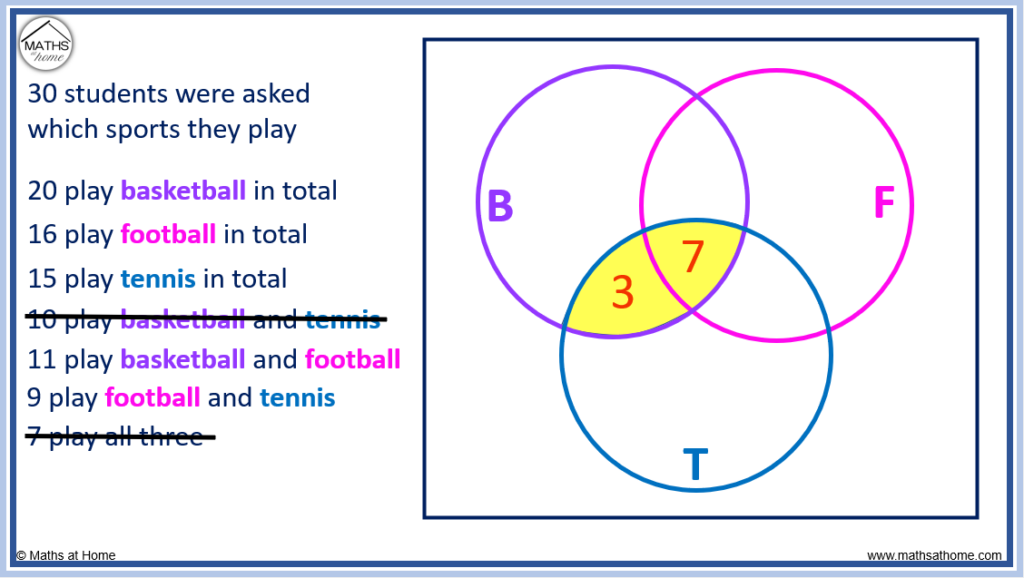
2. Write the remaining number of items belonging each pair of the sets in their overlapping regions
There are 3 regions in which exactly two circles overlap.
There is the overlap of basketball and tennis, basketball and football and then tennis and football.
There are 10 students that play both basketball and tennis. The overlapping region of these two circles is shown below. We already have the 7 students that play all three sports in this region.
Therefore we only need 3 more students who play basketball and tennis but do not play football to make the total of this region add up to 10.
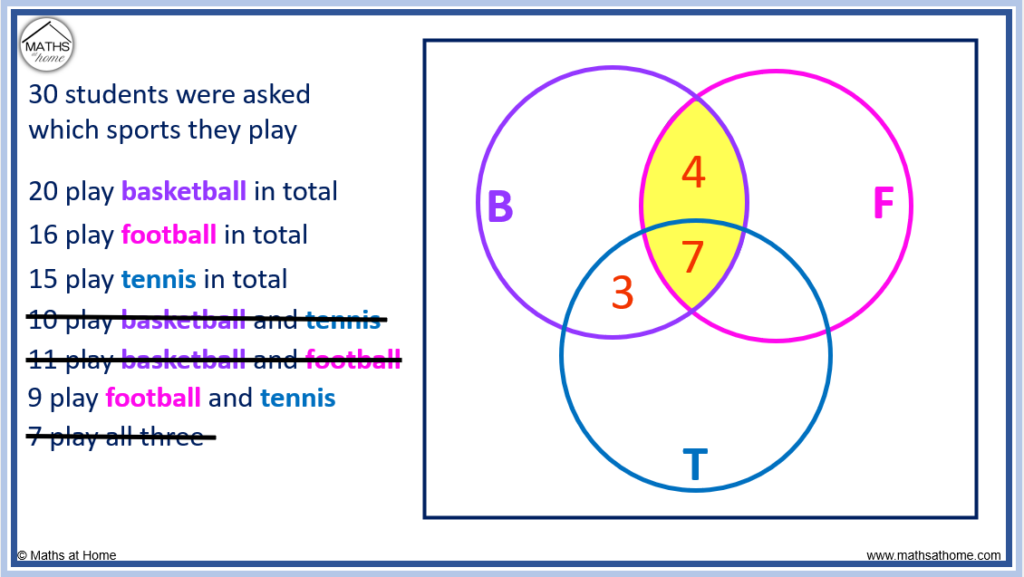
The next overlapping region of two circles is those that play basketball and football. There are 11 students in total that play both.
The overlapping region of the basketball and football circles is shown below.
There are already 7 students who play all three sports and so, a further 4 students must play both basketball and football but not tennis in order to make the total in this shaded region add up to 11 students.
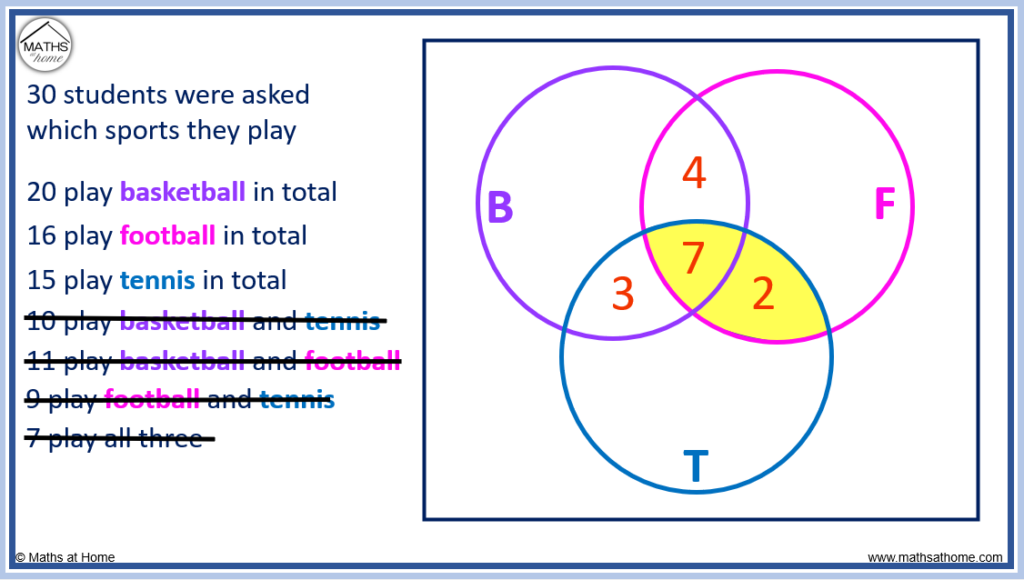
The next overlapping region of two circles is those that play football and tennis. There are 9 students in total that play both.
The overlapping region of the football and tennis circles is shown below.
There are already 7 students who play all three sports and so, a further 2 students must play both football and tennis but not basketball in order to make the total in this shaded region add up to 9 students.
Write the remaining number of items belonging to each individual set in the non-overlapping region of each circle
There are three individual sets which are represented by the three circles. There are those that play basketball, football and tennis.
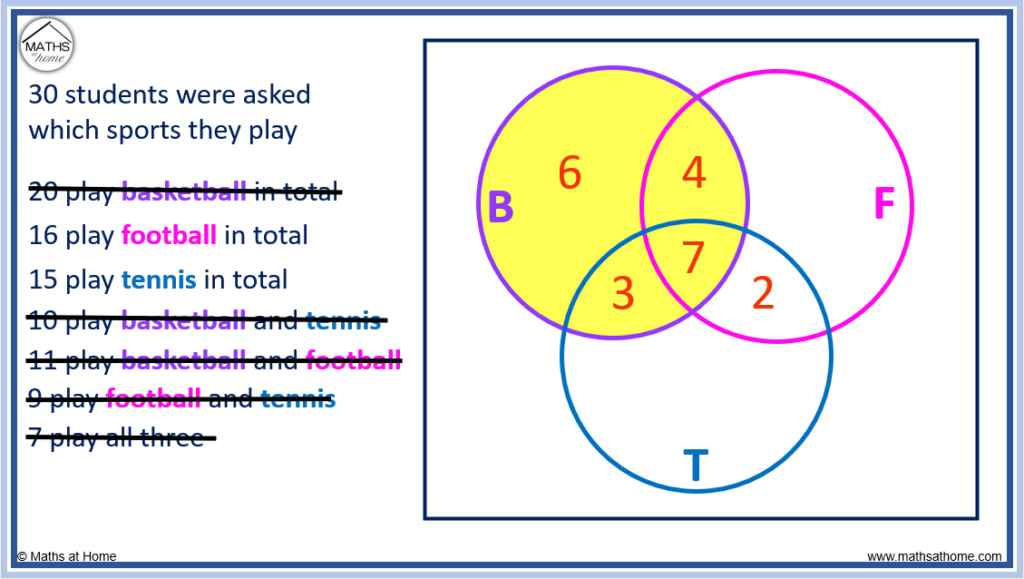
20 students play basketball in total. These 20 students are shown by the shaded circle below.
We already have 3, 7 and 4 students in the overlapping regions. This is a total of 14 students so far. We need a further 6 students who only play basketball in order for the numbers in this circle to make a total of 20.
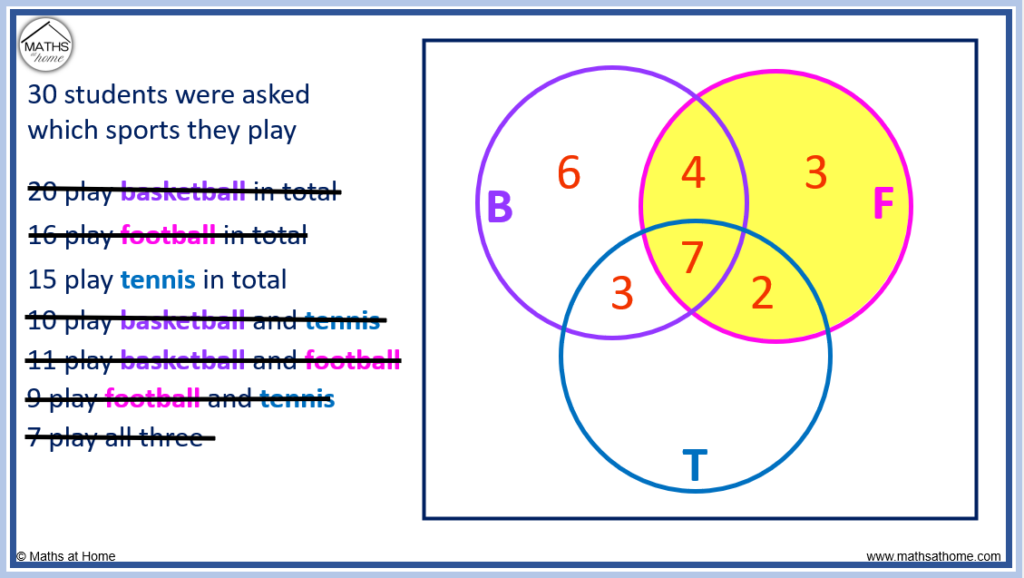
The next individual sport is football. 16 students play football in total.
There are already 4, 7 and 2 students in the overlapping regions. This makes a total of 13 students so far.
3 more students are required to make the circle total up to 16. 3 students play only football and not basketball and tennis.
Finally, there are 15 students who play tennis shown by the shaded region below.
There are already 3, 7 and 2 students in the overlapping regions, making a total of 12 students.
A further 3 students are required to make the total of 15 students in this circle.
3 students play tennis but not basketball or football.
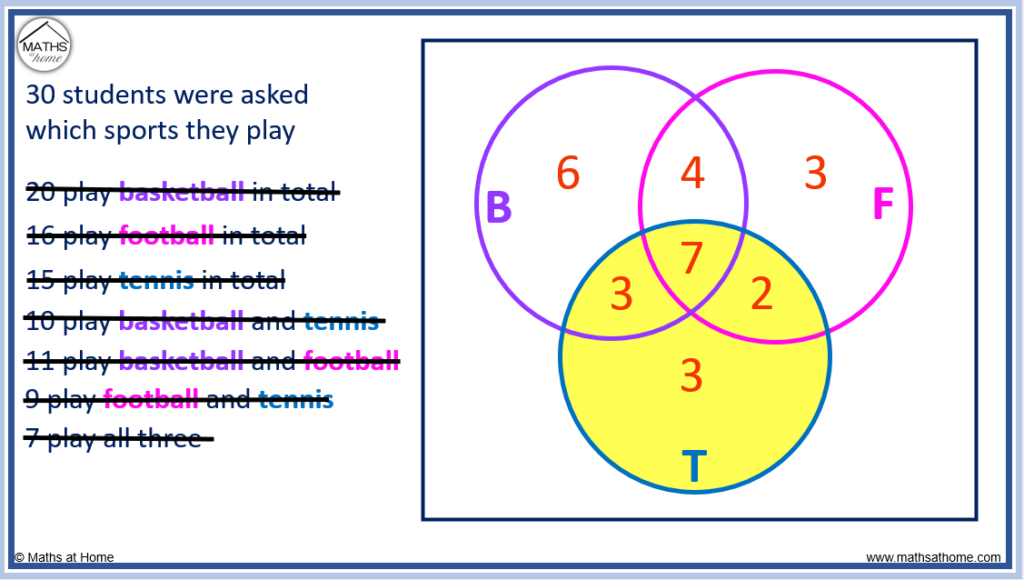
The values in each circle sum to 28 students.
That is 6 + 4 + 3 + 7 + 3 + 2 + 3 = 28.
Since there are 30 students who were asked in total, a further 2 students must play none of these three sports.
How to Solve a Venn Diagram with 3 Circles
To solve a Venn diagram with 3 circles, start by entering the number of items in common to all three sets of data. Then enter the remaining number of items in the overlapping region of each pair of sets. Enter the remaining number of items in each individual set. Finally, use any known totals to find missing numbers.
Venn diagrams are particularly useful for solving word problems in which a list of information is given about different categories. Numbers are placed in each region representing each statement.
Example 1:
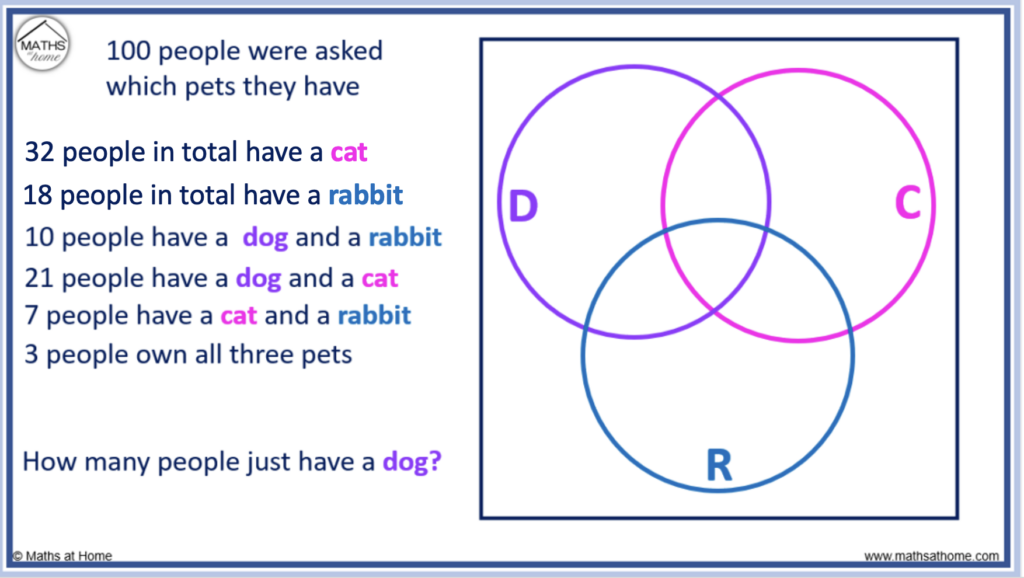
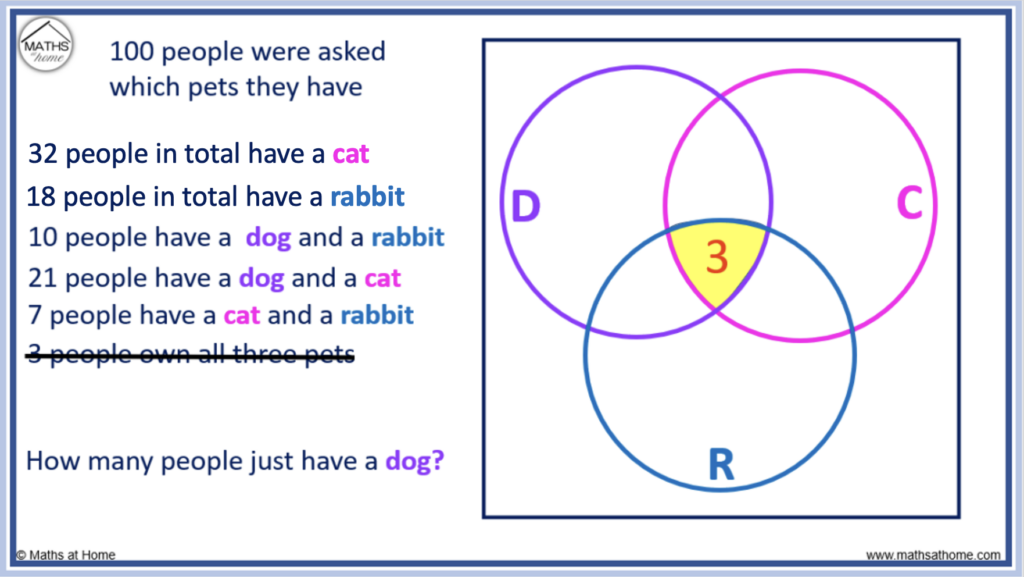
100 people were asked which pets they have.
- 32 people in total have a cat
- 18 people in total have a rabbit
- 10 people have just a dog and a rabbit
- 21 people have just a dog and a cat
- 7 people have just a cat and a rabbit
- 3 people own all three pets
How many people just have a dog?
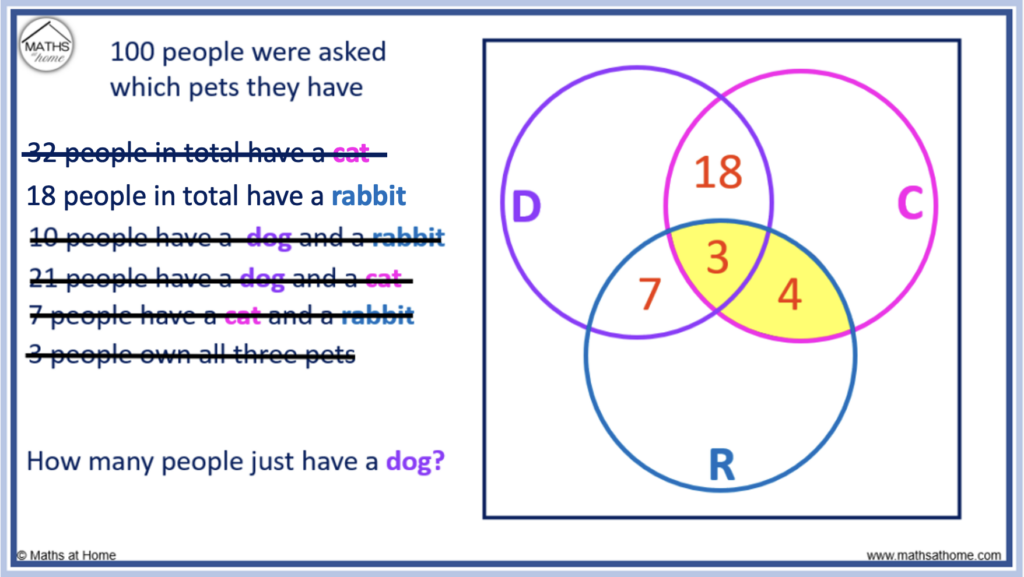
Start by entering the number of items in common to all three sets of data
3 people own all three pets and so, a number 3 is written in the overlapping region of all three circles.
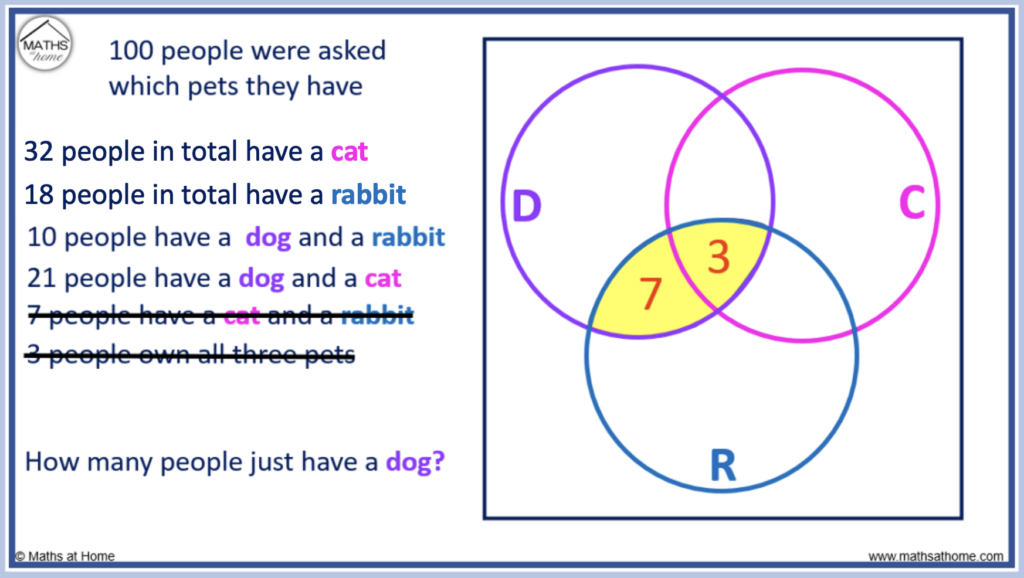
Then enter the remaining number of items in the overlapping region of each pair of sets
10 people have just a dog and a rabbit.
Since 3 people are already in this region, 7 more people are needed.
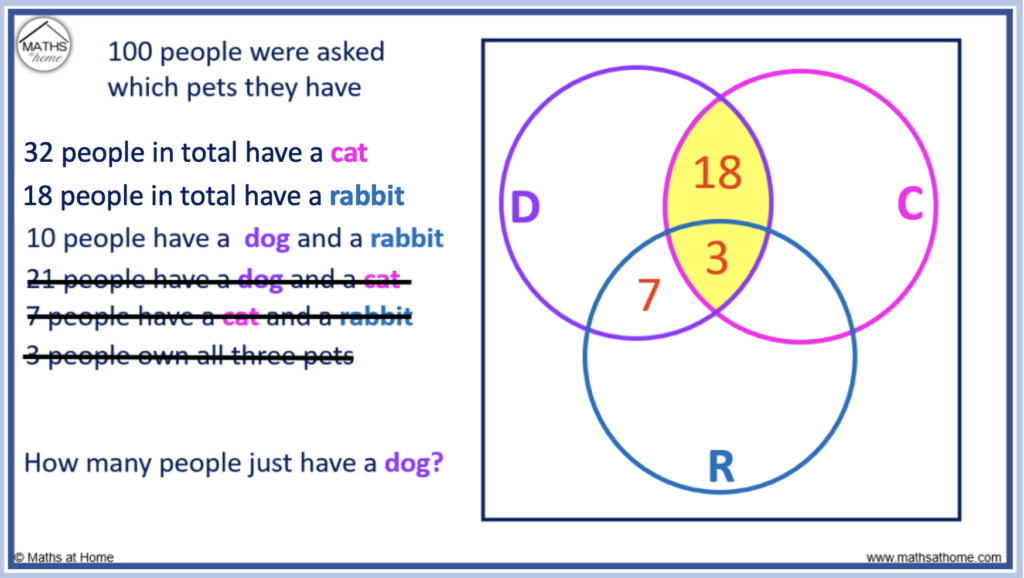
21 people have just a dog and a cat.
Since 3 people are already in this region, 18 more people are needed.
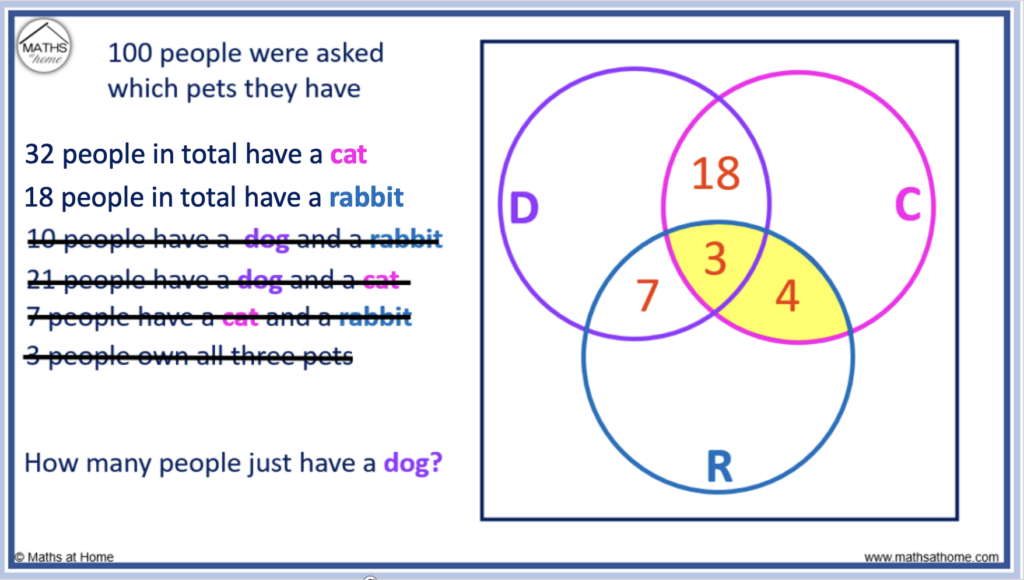
7 people have just a cat and a rabbit.
Since 3 people are already in this region, 4 more people are needed.
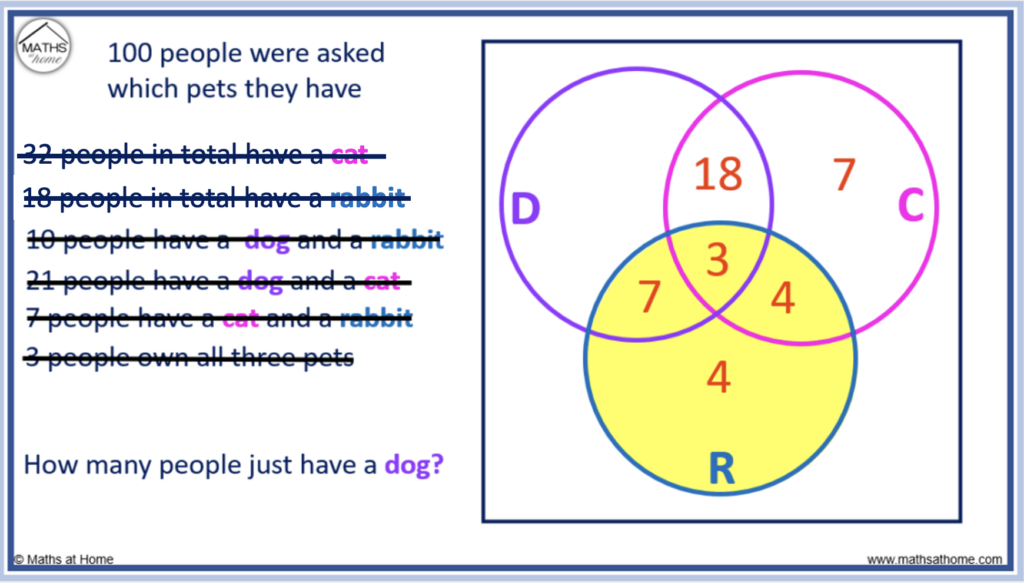
Enter the remaining number of items in each individual set
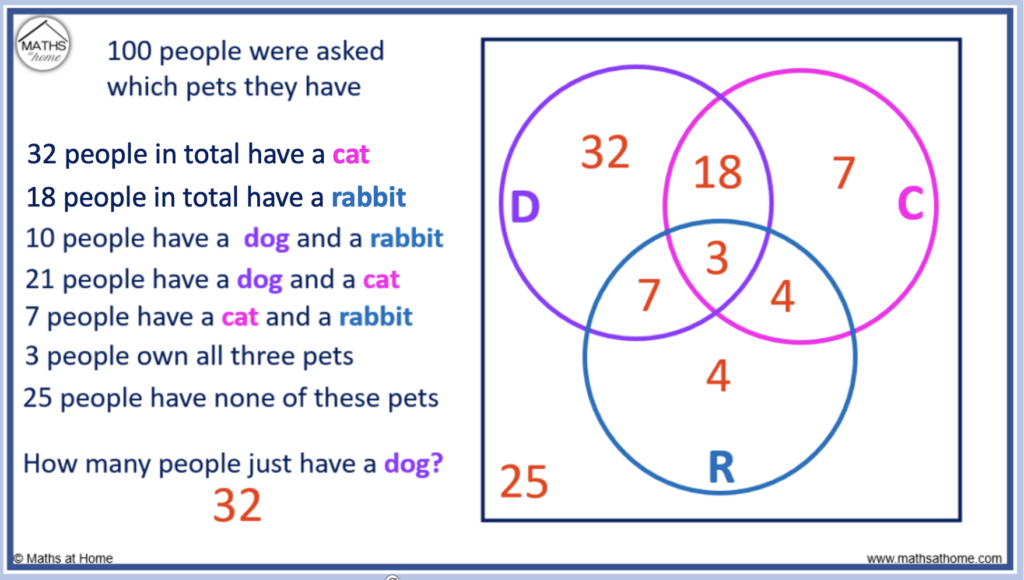
32 people in total have a cat.
There are already 18 + 3 + 4 = 25 people in this circle.
Therefore a further 7 people are needed in this circle to make 32.
7 people just own a cat and no other pet.
18 people in total have a rabbit.
There are already 7 + 3 + 4 = 14 people in this circle.
Therefore a further 4 people are needed in this circle to make 18.
4 people just own a rabbit and no other pet.
Finally, use any known totals to find missing numbers
We are now told that 25 people own none of these pets. This means that a 25 is written outside of all of the circles but still within the Venn diagram.
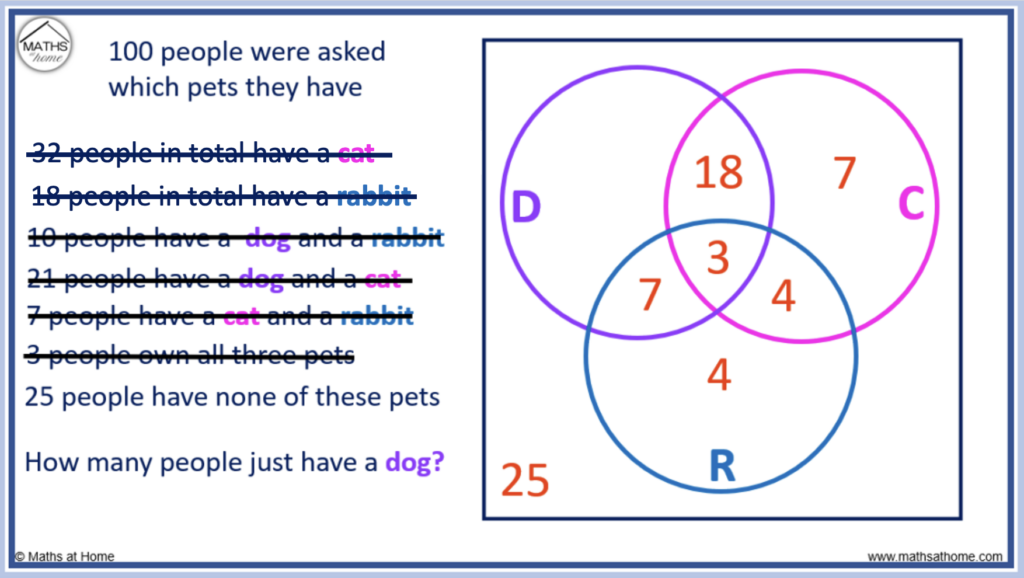
The question requires the number of people who just own a dog.
There are 100 people in total and so, all of the numbers in the complete Venn diagram must add up to 100.

Adding the numbers so far, 3 + 7 + 4 + 18 + 4 + 7 + 25 = 68 people in total.
Since the numbers must add to 100, there must be a further 32 people who own a dog.
Now all of the numbers in the Venn diagram add to 100.
Venn Diagram with 3 Circles Template
Here is a downloadable template for a blank Venn Diagram with 3 circles.
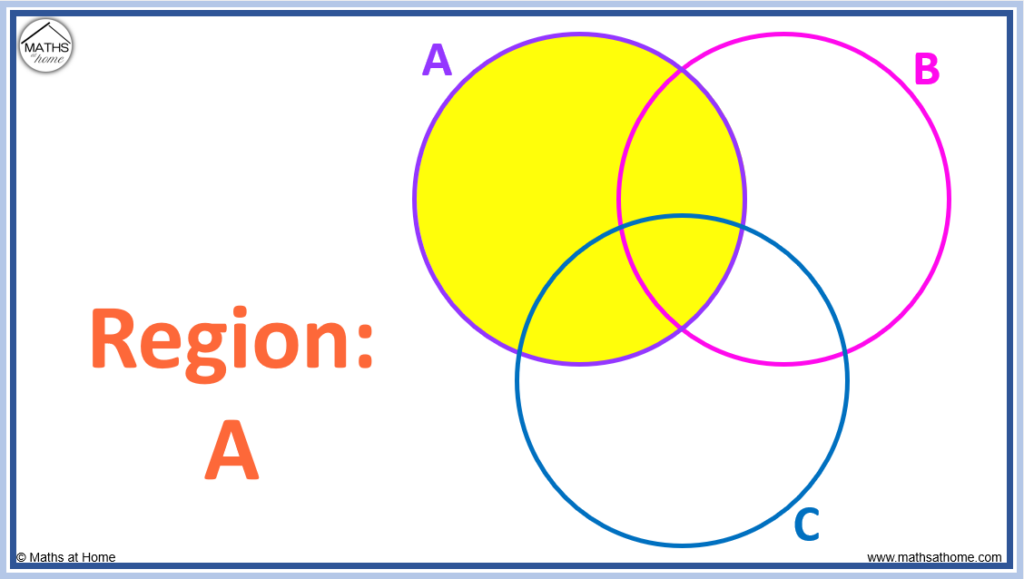
How to Shade a Venn Diagram with 3 Circles
Here are some examples of shading Venn diagrams with 3 sets:
Shaded Region: A
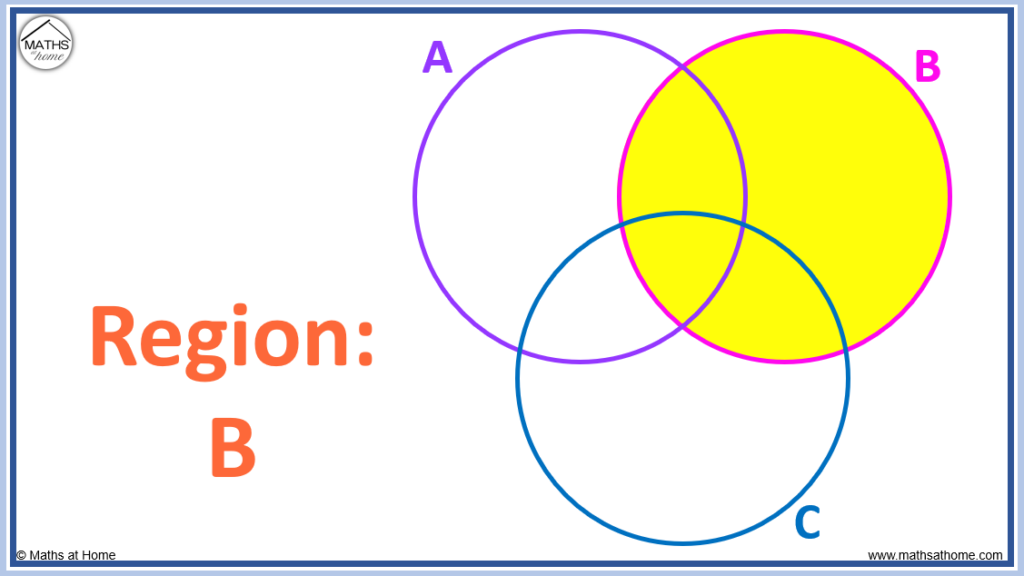
Shaded Region: B
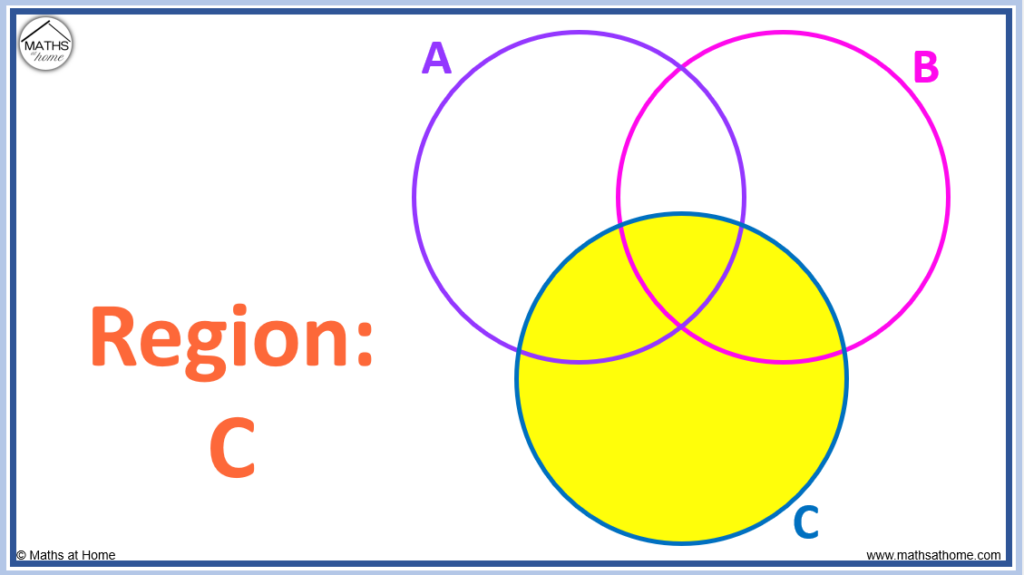
Shaded Region: C
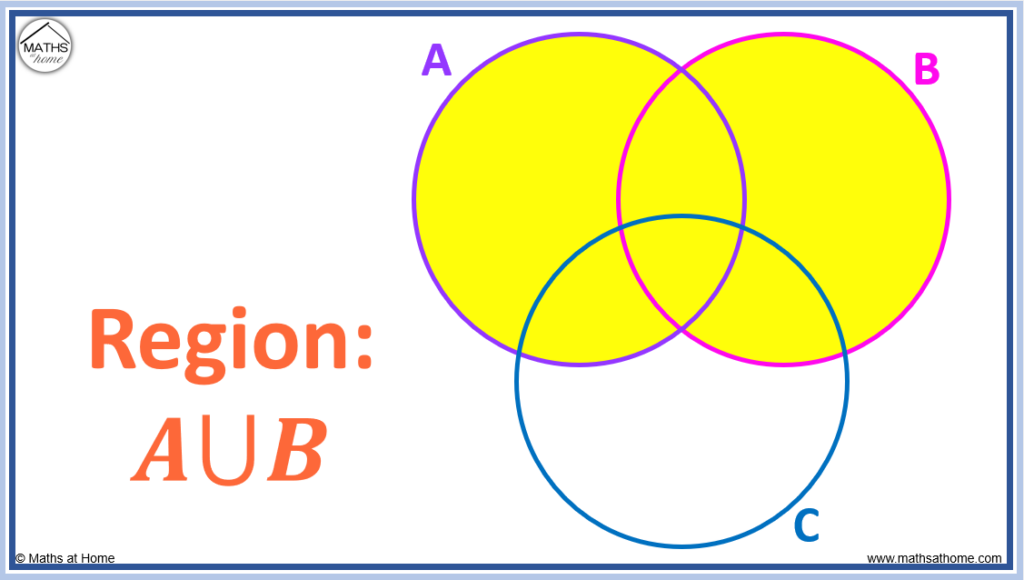
Shaded Region: A∪B
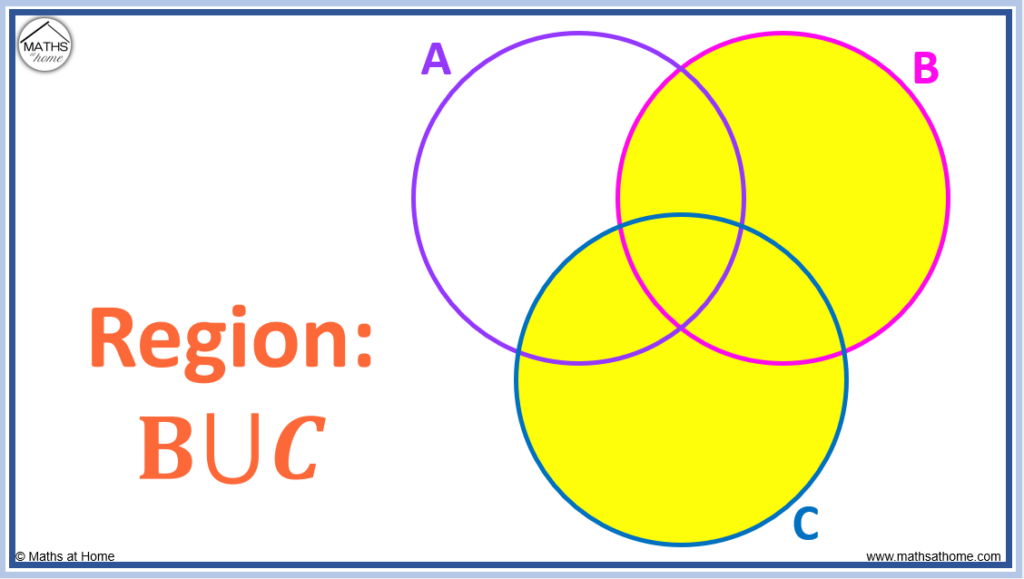
Shaded Region: B∪C
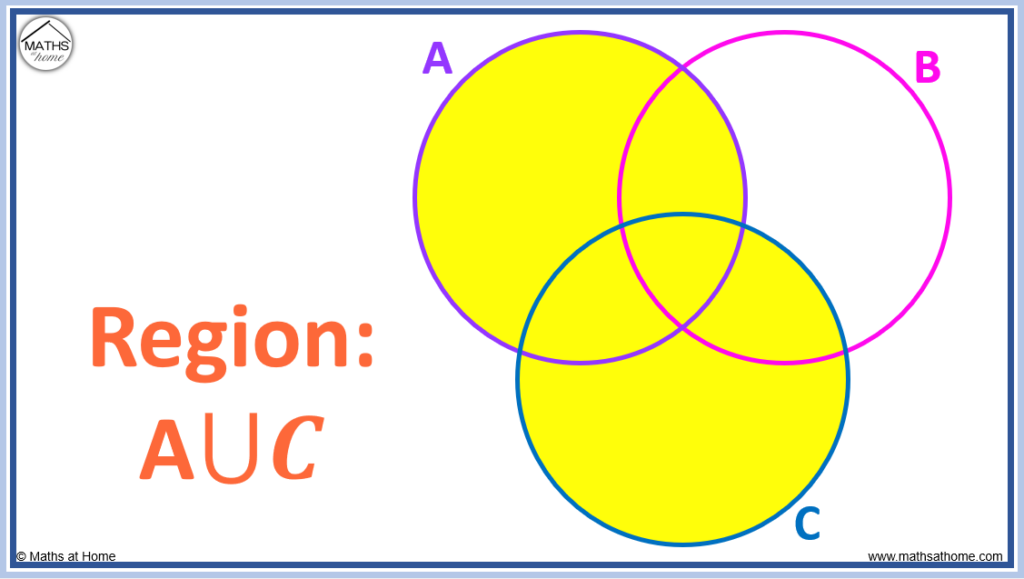
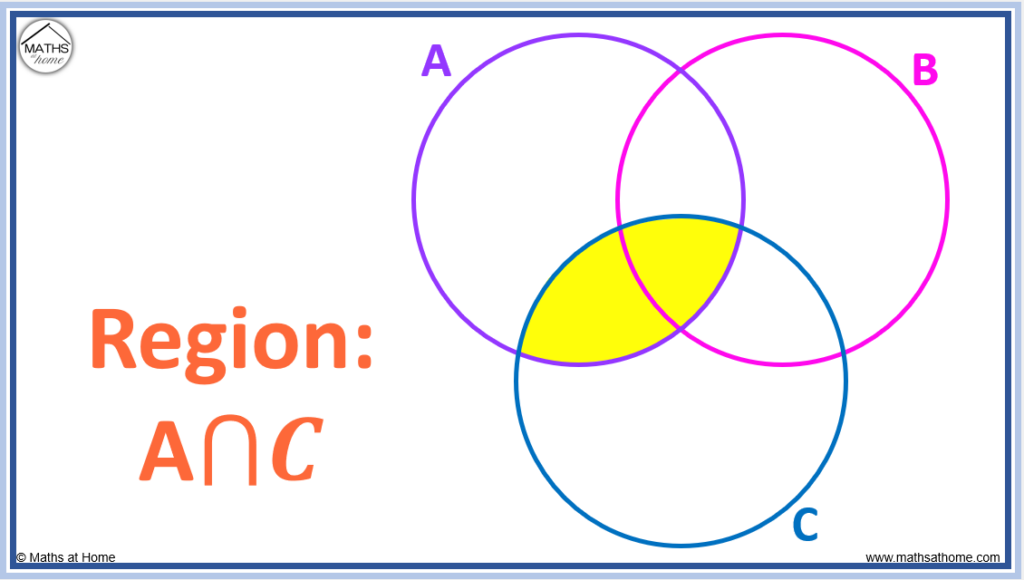
Shaded Region: A∪C
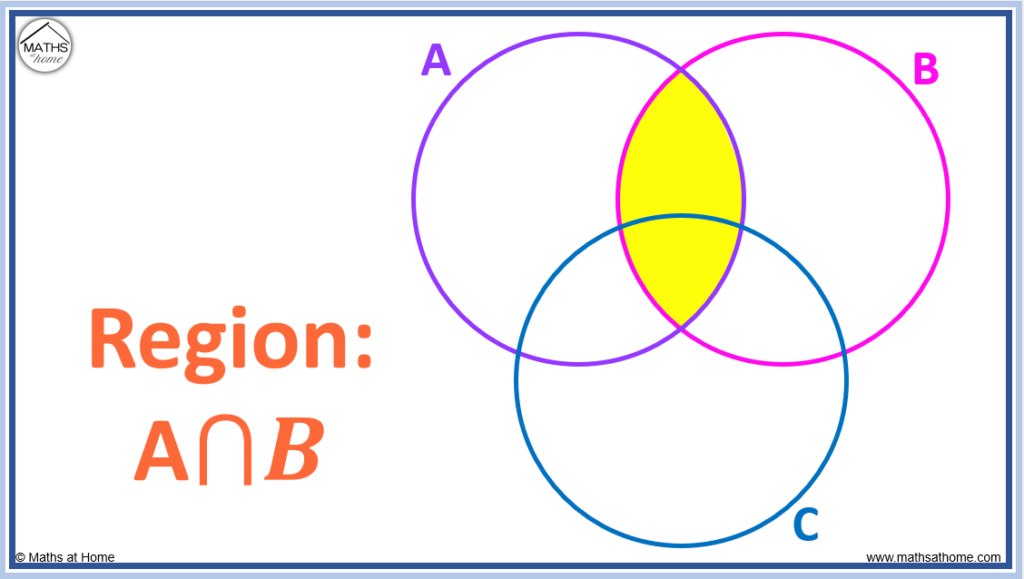
Shaded Region: A∩B
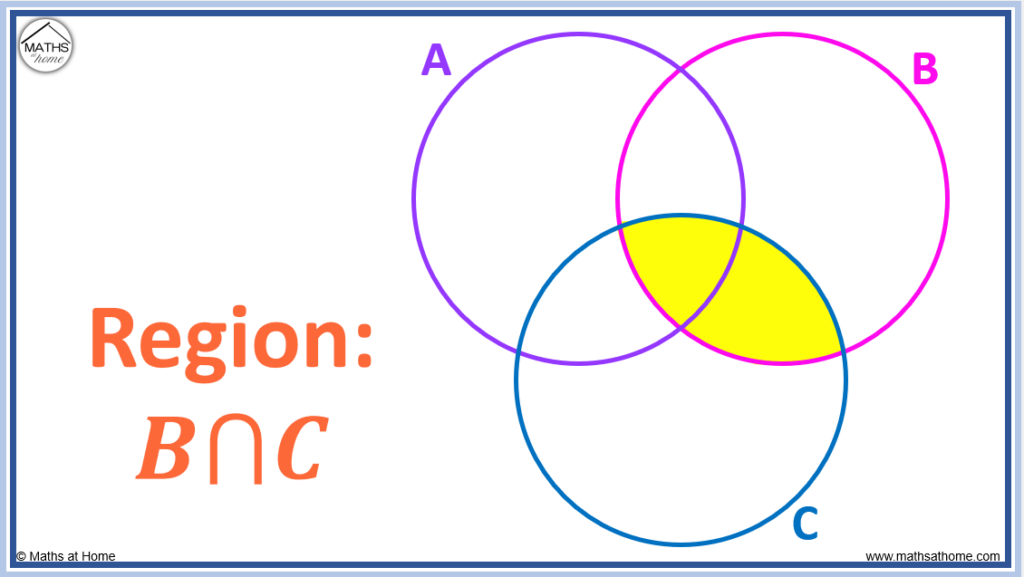
Shaded Region: B∩C
Shaded Region: A∩C
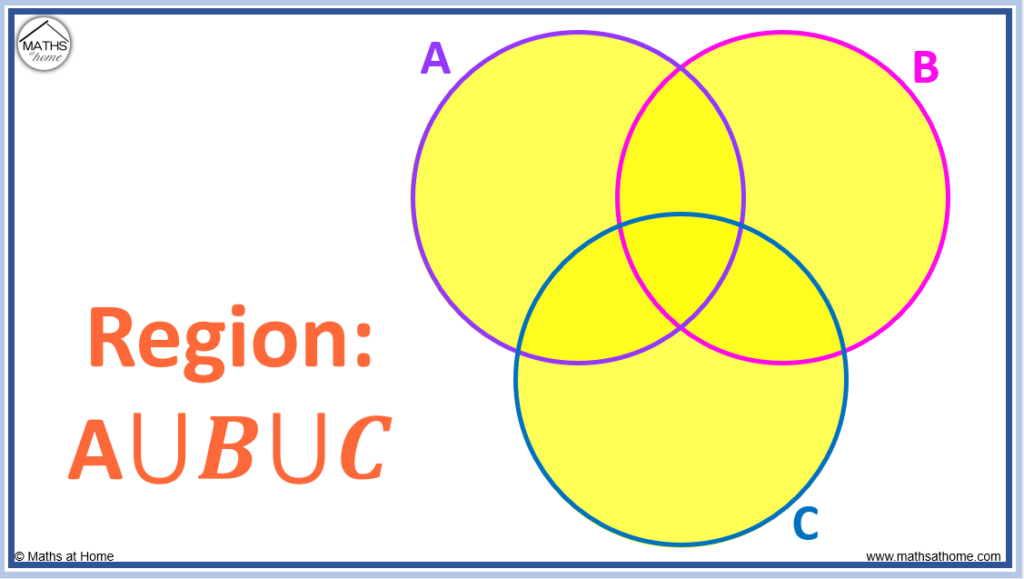
Shaded Region: A∪B∪C
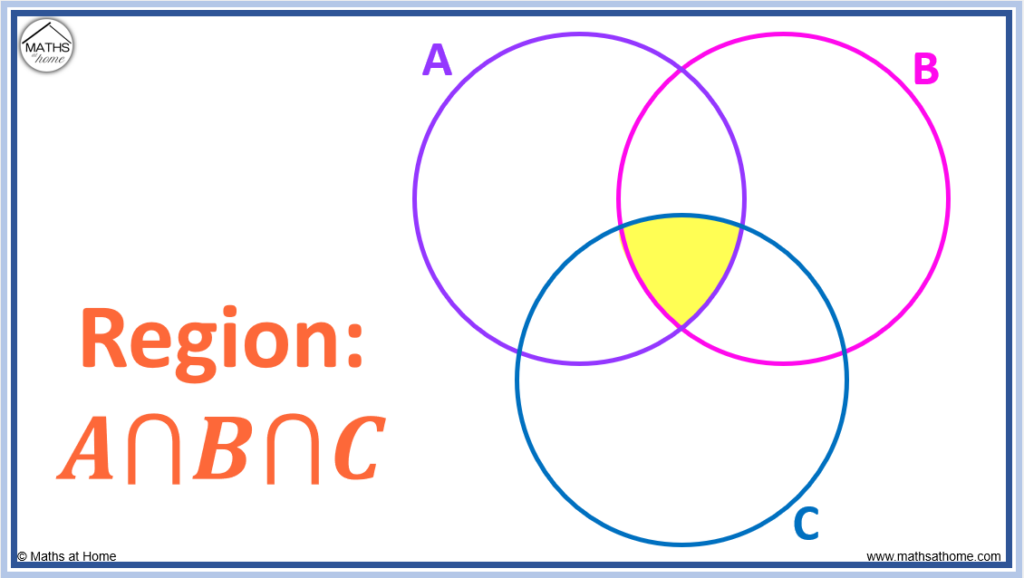
Shaded Region: A∩B∩C
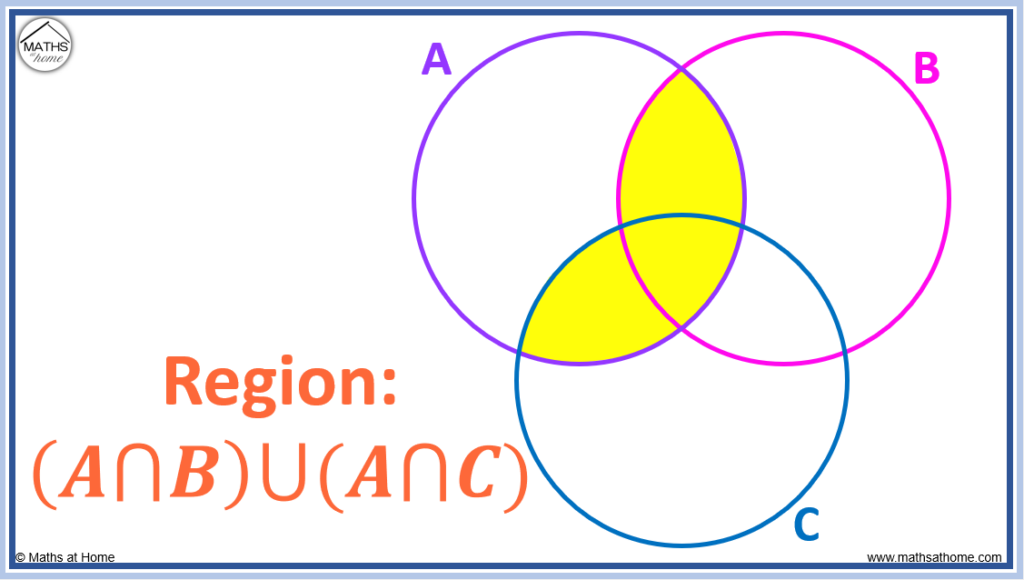
Shaded Region: (A∩B)∪(A∩C)