Sign Diagram Video Lessons
How to Make a Sign Diagram for a Function
How to Make a Sign Diagram from a Graph
What is a Sign Diagram?
A sign diagram shows the intervals where a function has positive or negative outputs. The 𝑥-axis intercepts are written on the axis of the sign diagram. In between these intercepts, a positive sign is written if the graph is above the 𝑥-axis and a negative sign is written if it is below the 𝑥-axis.
The graph of the function below shows where the function is above and below the 𝑥-axis.
A positive sign is written on the sign diagram in the regions that the graph is above the axis and a negative sign is written on the sign diagram in the regions that the graph is below the axis.

The graph cuts the 𝑥-axis at -6, -3, 1 and 7. These points are written on the sign diagram.
Positive signs are written where the function is above the 𝑥-axis. This is because this is where the function has a positive output.
This occurs for 𝑥<-6, -3<𝑥<1 and 7<𝑥.
Negative signs are written where the function is below the 𝑥-axis. This is because this is where the function has a negative output.
This occurs for -6<𝑥<-3 and 1<𝑥<7.
What is a sign diagram used for?
A sign diagram provides key information about a function such as:
- The f(𝑥) sign diagram displays where the function outputs are positive or negative.
- The f(𝑥) sign diagram lists all 𝑥-axis intercepts, the roots of the function.
- The f'(𝑥) sign diagram displays intervals for which the function is increasing or decreasing.
- The f'(𝑥) sign diagram lists all stationary points (maxima, minima and stationary inflection points).
- The f'(x) sign diagram allows us to classify stationary points as maxima, minima or stationary inflection points.
- The f”(x) sign diagram displays intervals for which the curvature of the function is concave up or concave down.
- The f”(x) sign diagram lists all points of inflection of the function.
How to Make a Sign Diagram
A sign diagram can be made without a graph, simply by considering the equation of the function.
To make a sign diagram:
- Mark all values for which the function is equal to zero.
- Substitute values of 𝑥 into the function chosen from between each of these marked values.
- If the answer is positive, mark the region with a + sign.
- If the answer is negative, mark the region with a – sign.
For example, make a sign diagram for .
Mark all values for which the function is equal to zero
We first set f(𝑥) = 0 and solve for 𝑥.
It can help to factorise a function in order to do this if it is not already factorised.
and so 𝑥 = 0 or 𝑥 = 3.
We mark both 0 and 3 on the sign diagram.

Substitute values from each region into the function to obtain positive or negative outputs
To the left of the 0 on the sign diagram, we can substitute any value of 𝑥 that is less than 0 into f(𝑥).
We substitute in 𝑥 = -1 to obtain a result of 4. This 4 is a positive number and so, we put a positive sign on this region of the sign diagram.
In between 0 and 3 we can substitute any value of 𝑥 into f(𝑥) provided that it is larger than 0 or less than 3.
We substitute 𝑥 = 1 into the function to obtain a result of -2. This is a negative output and so, we write a negative sign on the sign diagram.
Finally, we substitute a number that is larger than 3 into f(𝑥).
We substitute 𝑥 = 4 in to get a result of 4. This is positive, so we mark this region of the diagram with a positive sign.
It does not matter what the numerical result of the substitution is, only whether the result is positive or negative.
For example, instead of substituting 𝑥 = 4 in to find the sign of the rightmost region, we could have substituted in any number larger than 3, such as 𝑥 = 10.
Substituting 𝑥 = 10, would give a result of 70, which again is still positive.
Easy Method for Making a Sign Diagram
To make a sign diagram, only one value of 𝑥 needs to be substituted into the function. Decide if this result is positive or negative. From here, the other regions can be found depending if the power of the factor in the function is odd or even.
For example in the function , there are three factors. When each factor is equal to zero, there is a mark on the sign diagram.
The 𝑥 gives us a root of 𝑥 = 0.
The (𝑥 +1)3 gives us the root of 𝑥 = -1.
The (𝑥 – 2)2 gives us the root of 𝑥 = 2.

We can first substitute in the value of 𝑥 = 1 into the function. When we do we get a result of 8, which is positive. We label a positive sign where 𝑥 = 1 should be on the sign diagram.
From here we decide if we keep the sign as positive or change it to negative when we move into an adjacent region.
If the power of the factor in the equation is odd, the sign changes as we move across the corresponding root.
If the power of the factor in the equation is even, the sign remains the same as we move across the corresponding root.
As we move right past 𝑥 = 2, this 2 came from the factor of (𝑥 – 2)2. This power of 2 is even and so, the positive sign in the region from 0<𝑥<2 remains as a positive sign as we move into the region 2<𝑥.
As we move left past 𝑥 = 0, this 0 came from the factor of 𝑥. This is 𝑥 to the power 1, which is odd. Therefore the positive sign in the region from 0<𝑥<2 becomes negative in the region -1<𝑥<0.
As we move further left past 𝑥 = -1, this -1 came from the factor of (𝑥 + 1)3. 3 is an odd number and so the sign will change. The negative sign in the region -1<𝑥<0 becomes a positive sign in the region 𝑥<-1.
Sign Diagram for the First Derivative
A sign diagram of the first derivative, f'(𝑥) can be made. The stationary points are written on the sign diagram. In the regions between these points, a positive sign is written when the function is increasing and a negative sign is written when the function is decreasing.

- Mark the 𝑥 coordinates of all stationary points on the sign diagram line.
- Consider each region between these marked points.
- If the graph is increasing or f'(𝑥) is positive, write a positive sign on the diagram in this region.
- If the graph is decreasing or f'(𝑥) is negative, write a negative sign on the diagram in this region.
Mark the 𝑥 coordinates of all stationary points on the sign diagram line
In the function below, there are stationary points marked at 𝑥 = -4, 𝑥 = -1.5 and 𝑥 = 5.
These are then written on the axis of the sign diagram.
If the graph is increasing, write a positive sign and if the graph is decreasing, write a negative sign
If the graph is increasing, it is going up as it goes left to right.
If the graph is decreasing, it is going down as it goes left to right.
Before 𝑥 = -4, the graph is decreasing. We put a negative sign in this region of the diagram.
Between 𝑥 = -4 and 𝑥 = -1.5, the graph is increasing. We put a positive sign in this region of the diagram.
Between 𝑥 = -1.5 and 𝑥 = 5, the graph is decreasing. We put a negative sign in this region of the diagram.
After 𝑥 = 5, the graph is increasing. We put a positive sign in this region of the diagram.
Classifying Stationary Points
Classifying a stationary point means to identify whether it is a maximum, minimum or stationary inflection. The sign diagram of the first derivative can be used. +/ – corresponds to a maximum point. – / + is a minimum and – / – or + / + are stationary inflection points.

To find stationary points, differentiate the function and set it equal to zero. Solve the resulting equation for 𝑥.
Complete the sign diagram for f'(𝑥) by substituting values of 𝑥 into it for each region.
Use the table below to classify each stationary point by considering the pattern on each side of the stationary point.
| First Derivative Sign Diagram | Type of Stationary Point |
| + / – | Maximum |
| – / + | Minimum |
| – / – or + / + | Stationary Inflection |
Sign Diagram for the Second Derivative
In calculus, the sign diagram for the second derivative f”(𝑥) describes the curvature of the graph. A positive value of f”(𝑥) indicates a concave up interval of curvature. A negative value of f”(𝑥) indicates a concave down interval. f”(𝑥) is zero at points of inflection.

On the graph above, the sign diagram for the second derivative is shown.
There is positive curvature in the regions 𝑥<-4, 0<𝑥<4.5 and 7<𝑥.
There is negative curvature in the regions -4<𝑥<0 and 4.5<𝑥<7.
The points of inflection are marked on the sign diagram of the second derivative at 𝑥 = -4, 𝑥 = 0, 𝑥 = 4.5 and 𝑥 = 7. The points of inflection are where the curvature changes from positive to negative.
Using a Sign Diagram to Solve an Inequality
Sign diagrams can be used to solve inequalities. First construct a sign diagram for the function. If the inequality requires the function to be greater than zero, these are the positive intervals. If the inequality requires the function to be less than zero, these are the negative intervals.
For example, find the intervals for which .
We construct the sign diagram as shown below.

Since we require , we require the intervals for which the function is greater than zero, or positive.
We look for the positive regions listed on the sign diagram.
Therefore for
and
.
We use both greater than or equal to and less than or equal to since the inequality in the question also allows the function to be equal to zero.
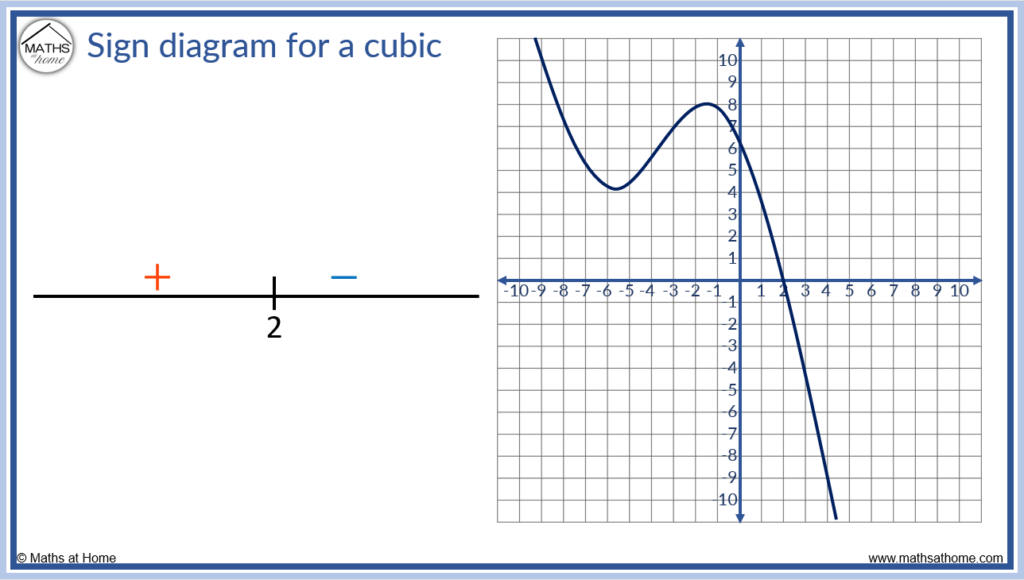
Sign Diagram for a Cubic Function
A sign diagram can be drawn for a cubic function with the axes intercepts listed.
Here are some examples of different cubic functions and their sign diagrams.


Sign Diagram for a Rational Function
When making a sign diagram for a rational function, the 𝑥-axis intercepts must be labelled and so must any values of 𝑥 which create a vertical asymptote. In a rational function, the numerator provides the 𝑥-axis intercepts and the asymptotes are where the denominator equals zero.
For example, create a sign diagram for the rational function .
The 𝑥 intercepts are found where the numerator equals zero. This is at 𝑥 = -2.
The vertical asymptotes are found where the denominator equals zero. This is at 𝑥 = 1.
We mark the asymptote with a dotted line on the sign diagram

We can substitute 𝑥 = 0 into the function to get an output of 8. This is positive and so, the middle region of the sign diagram (where 0 would be) is positive.
As we go past each axis intercept or asymptote on the sign diagram, we can see if the sign changes or not depending on the power of the factor that the value came from.
As we move right past the asymptote at 𝑥 = 1, this asymptote came from the (𝑥 – 1)2 on the denominator. 2 is even and so, we keep the sign the same. The positive sign remains as a positive as we move into the region greater than 1.
As we move left past the intercept at 𝑥 = -2, this value came from the (𝑥 + 2)3 on the numerator. 3 is an odd power and this will cause the sign to change as we move across this intercept. We change from positive to negative.