How to Find a 5 Number Summary: Video Lesson
What is the Five Number Summary?
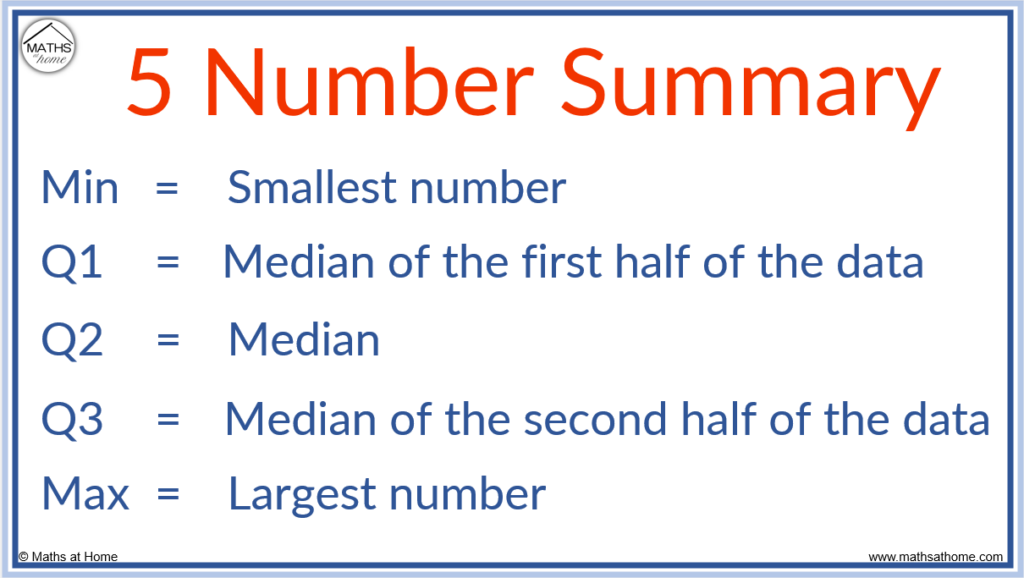
The five number summary consists of the minimum, lower quartile (Q1), median (Q2), upper quartile (Q3) and the maximum. The minimum is the smallest number, the maximum is the largest, the median is in the middle, Q1 is the median of the first half of the data and Q3 is the median of the second half.
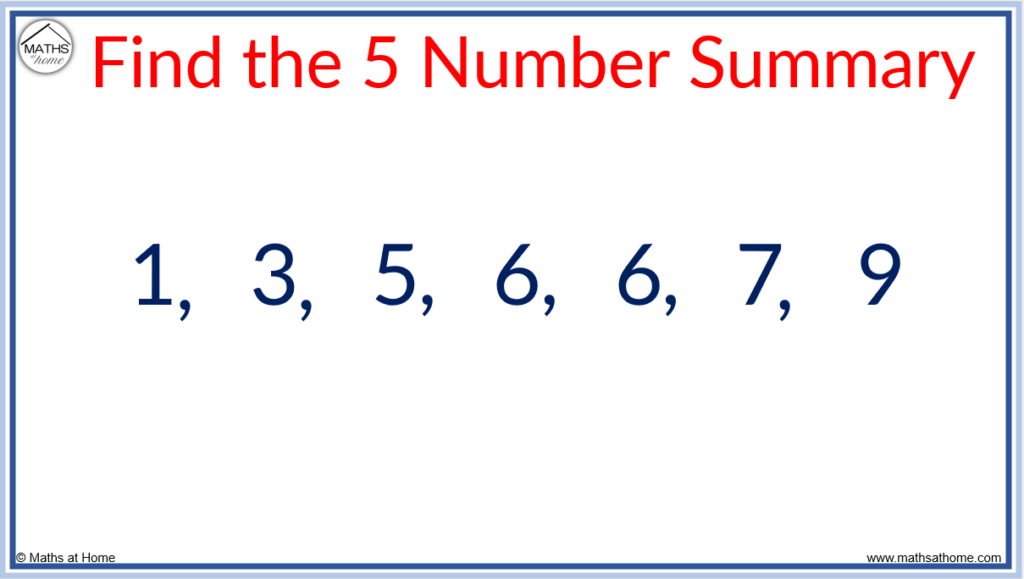
Below is a set of data and its five number summary.
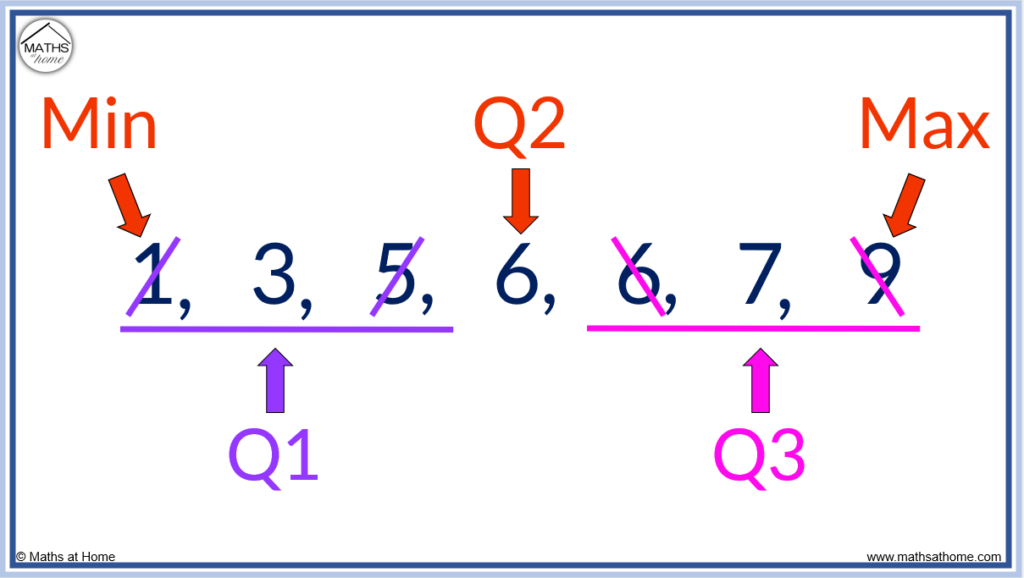
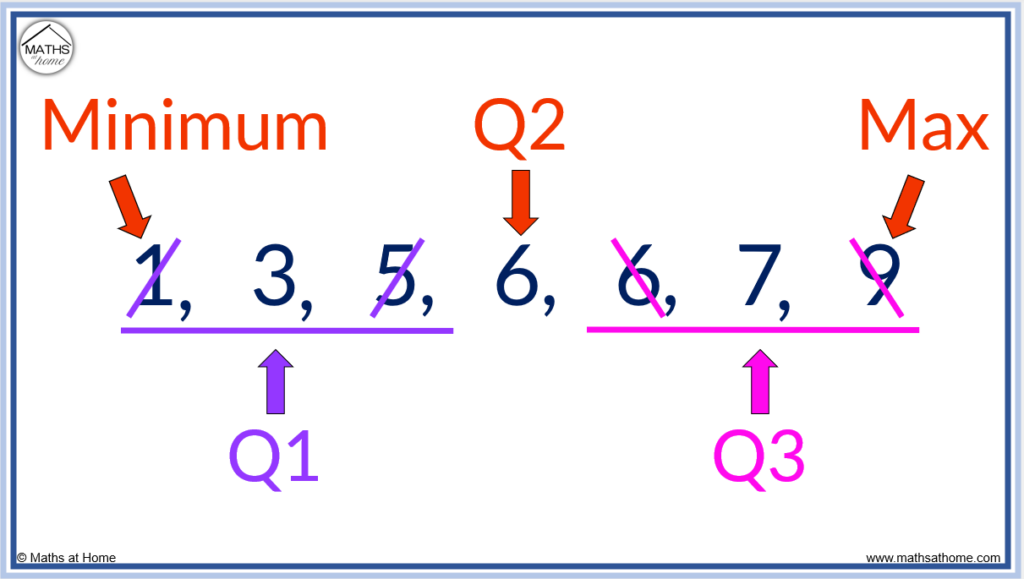
For the set of data: 1, 3, 5, 6, 6, 7, 9 the five number summary is:
- Minimum = 1
- Lower Quartile (Q1) = 3
- Median (Q2) = 6
- Upper Quartile (Q3) = 7
- Maximum = 9
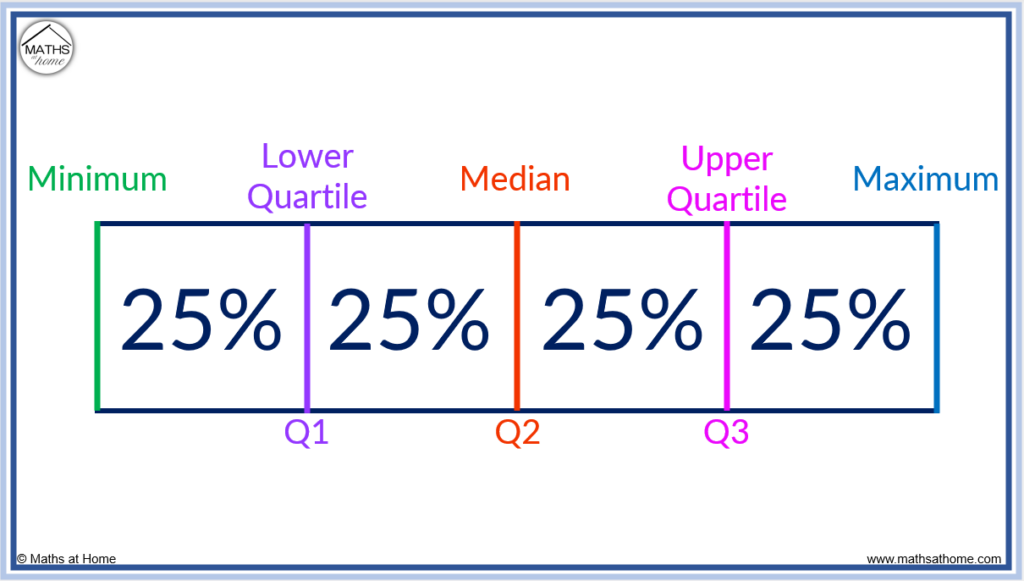
A quartile divides data into four parts. The lower quartile (Q1) is found after the bottom 25%. The median (Q2) is found after the second quartile, halfway through the data. The upper quartile (Q3) is found three-quarters of the way through the data.
The five number summary is used to describe a set of data. The median is the central value which indicates an average point in the data. The range can be found by subtracting the minimum from the maximum and the interquartile range can be found by subtracting the lower quartile (Q1) from the upper quartile (Q3).
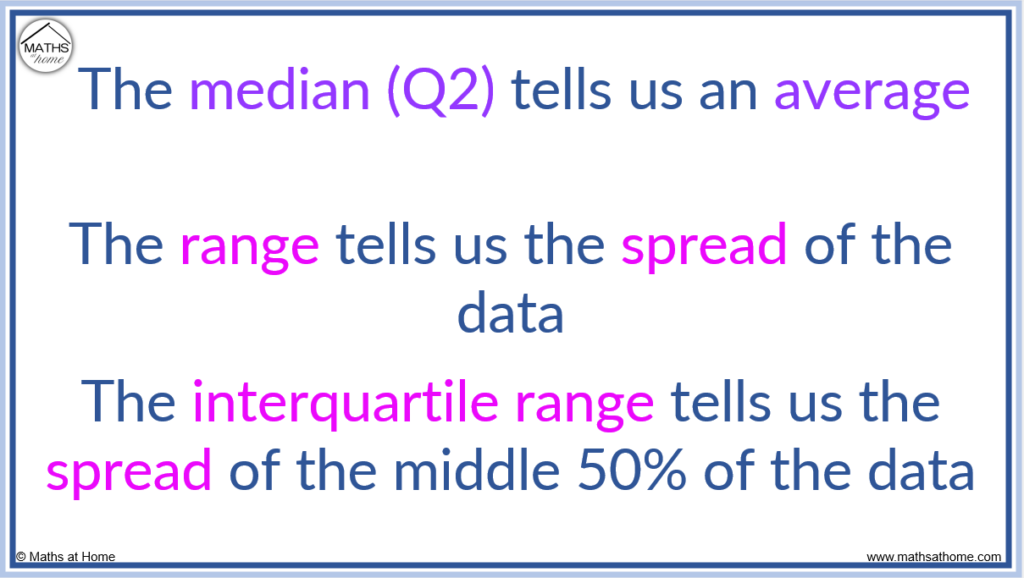
- The median (Q2) indicates the average
- The range = maximum – minimum indicates the spread of the whole data set
- The interquartile range = Q3 – Q1 indicates the spread of the middle 50% of the data set
The range describes the spread of the whole set of data, whilst the interquartile range describes the spread of the middle set of data.
The benefit of the range is that it describes the spread of all values in a data set, whereas the interquartile range only considers the middle 50% of data. However, this means that the range is greatly affected by outliers (extreme results in the data), where the interquartile range is not.
The interquartile range also describes the spread of the middle 50% data only. The interquartile range is useful when a comparison of the middle portion of data is required. This allows a comparison of ‘typical’ members of a set of data that does not include extreme values.
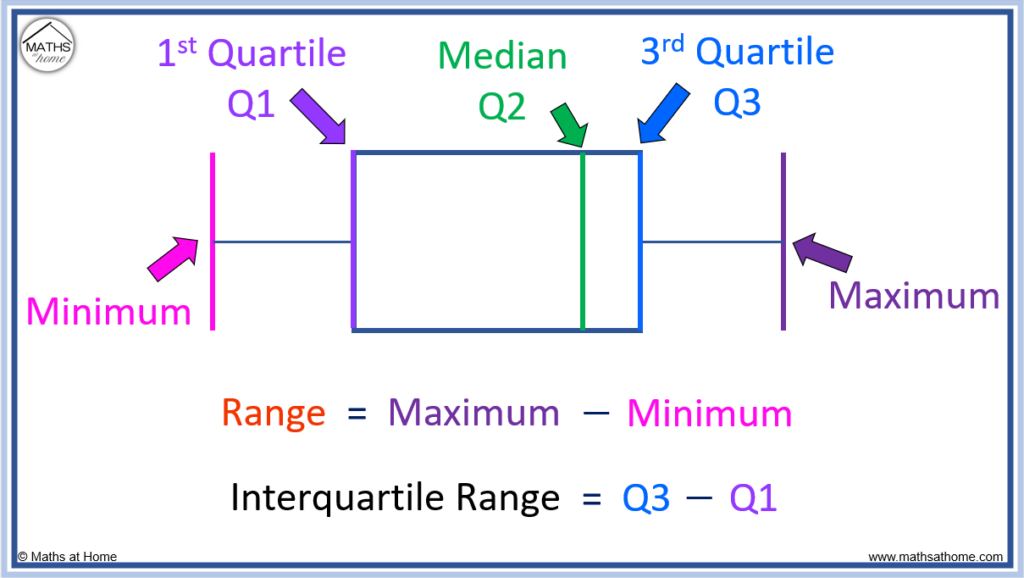
5 Number Summary on a Box Plot
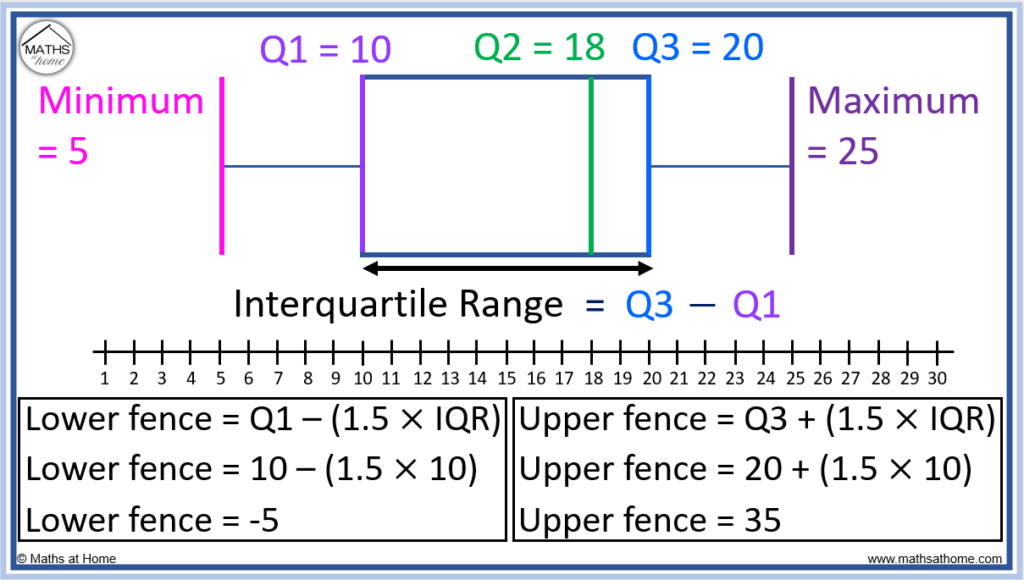
The 5 number summary consists of the minimum, lower quartile (Q1), median (Q2), upper quartile (Q3) and the maximum. On a box plot, the minimum and maximum are shown by the first and last lines respectively. The lower quartile is found where the box begins and the upper quartile is found where the box ends. The median is found at the line inside the box.
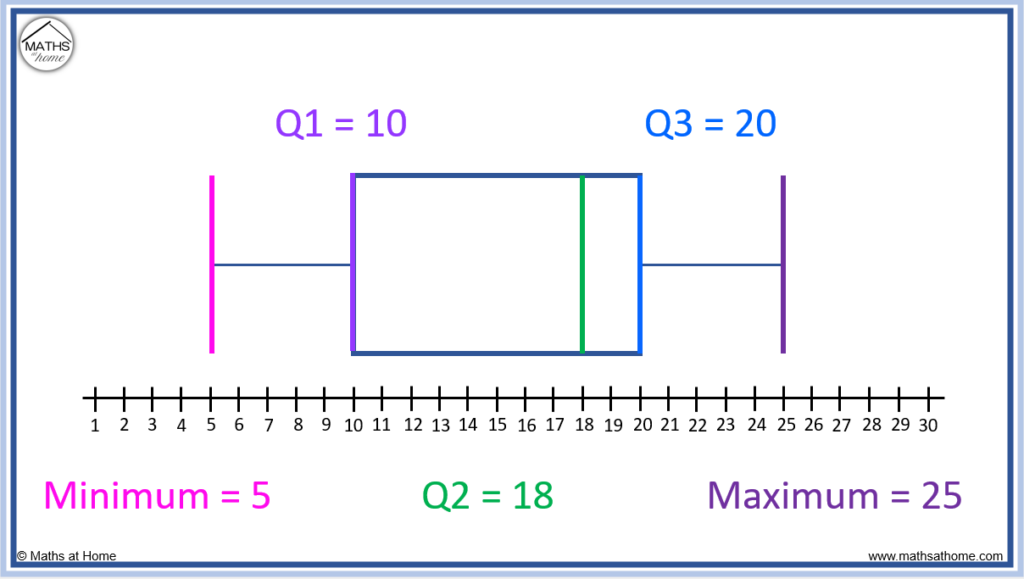
Here is an example of reading the 5 number summary from a box plot.
- The minimum is found at the position of the first line at 5
- The maximum is found at the position of the last line at 25
- The lower quartile (Q1) is found at the position of the start of the box at 10
- The upper quartile (Q3) is found at the position of the end of the box at 20
- The median (Q2) is found at the position of the line inside the box at 18
The range is found using the formula: range = maximum – minimum.
On a box plot, the range is equal to the length from the first line to the last line. The range is the length from whisker to whisker.
The interquartile range is found using the formula: IQR = Q3 – Q1.
The interquartile range is equal to the length of the box on a box plot.
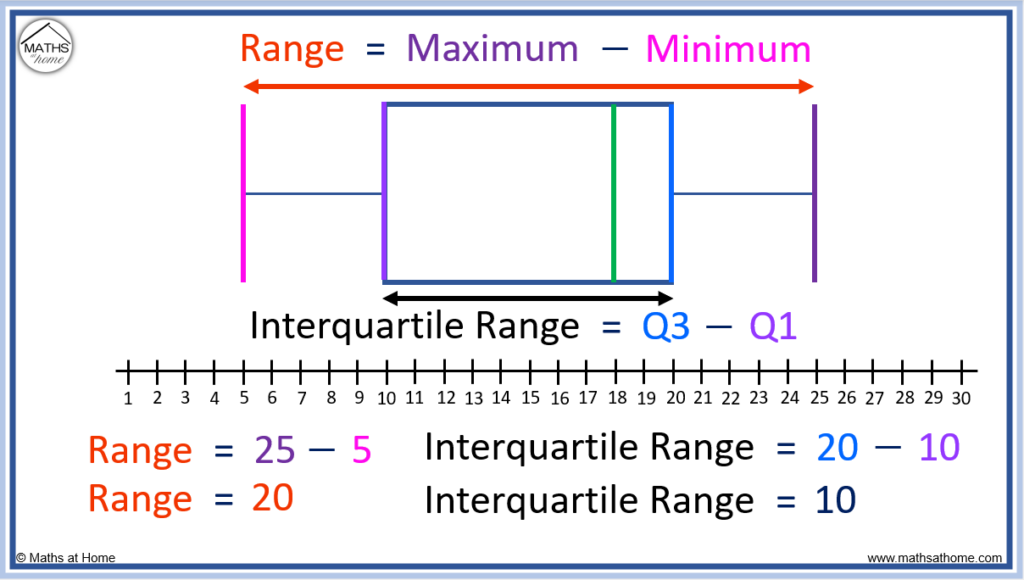
In this example, the maximum is 25 and the minimum is 5.
The range = 25 – 5 = 20. The range is 20 and so, the length from whisker to whisker on the box plot is 20.
The upper quartile (Q3) is 20 and the lower quartile (Q1) is 10.
The IQR = 20 – 10 = 10. The interquartile range is 10 and the length of the box portion of the box plot is 10.
Here is an example of using the 5 number summary to compare two box plots.
The median is used to compare the averages of sets of data.
The range and interquartile range are used to compare the spread of data.
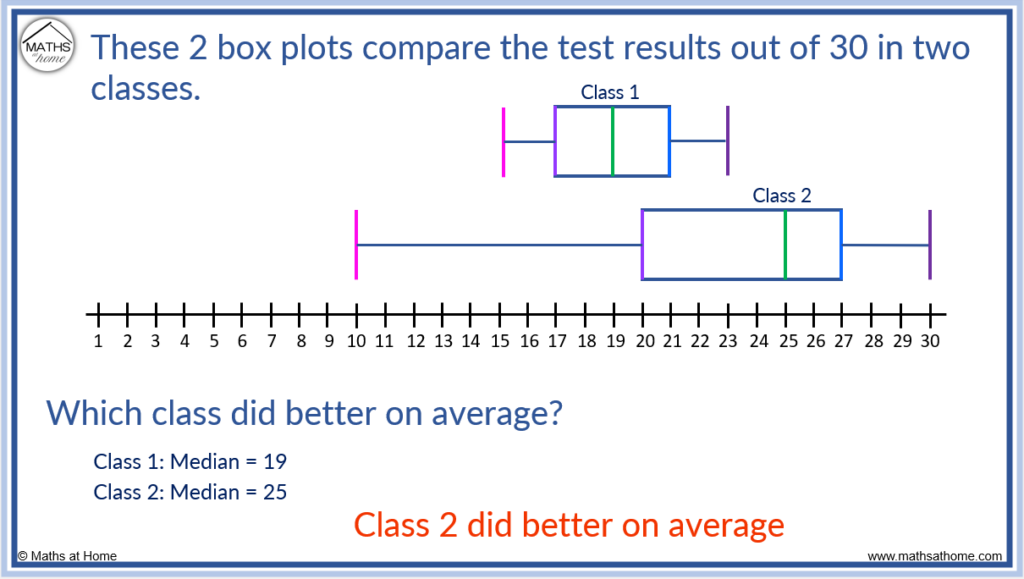
Averages are compared on a box plot using the position of the median. We can see that class 2 did better than class 1 on average because class 2 has a larger median.
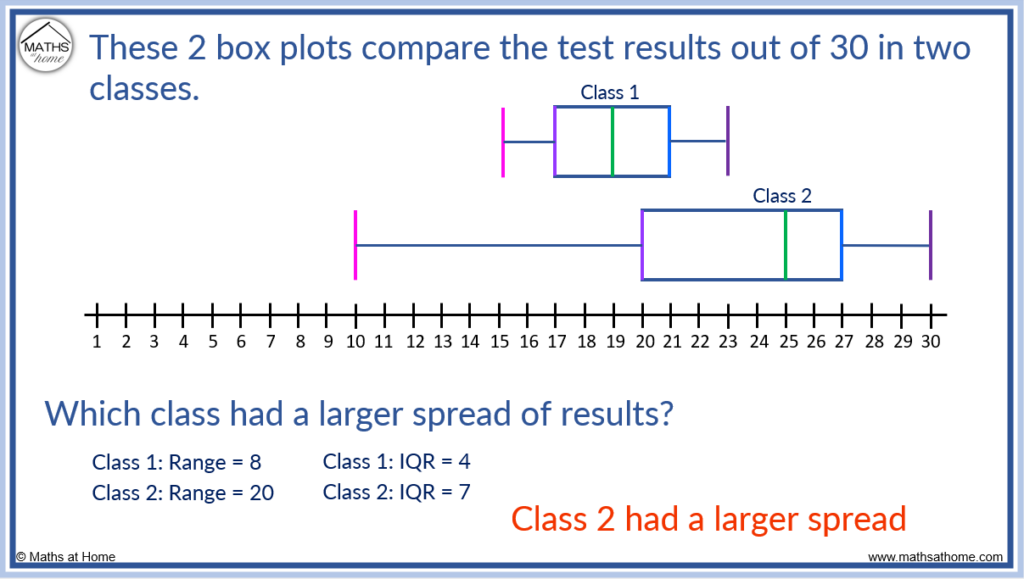
The spread is measured using the range and the interquartile range.
Class 2 has a larger range which indicates that the whole data set is more spread than class 1.
Class 2 has a larger interquartile range which indicates that the middle 50% of data in class 2 is more spread out than the middle 50% of data in class 1.
Overall, class 2 has a larger spread.
We can see that the box plot of class 2 is longer than the box plot of class 1. The length from whisker to whisker is longer which indicates a larger range. The length of the box itself is longer which indicates a larger interquartile range. Box plots allow us to compare two sets of data visually.
How to Find the Five Number Summary
To find a five number summary:
- Put the numbers in ascending order from smallest to largest.
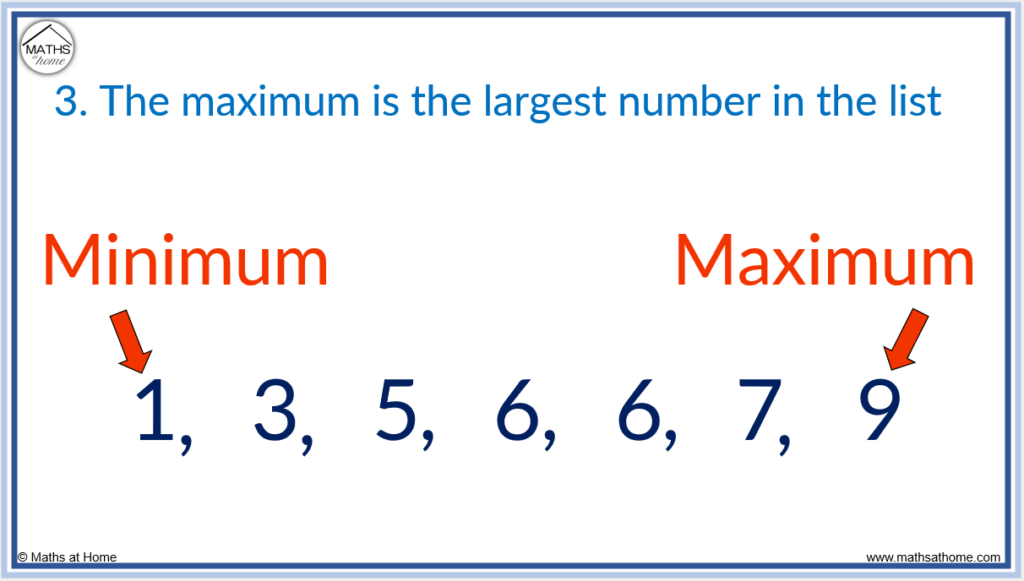
- The minimum is the smallest number in the list.
- The maximum is the largest number in the list.
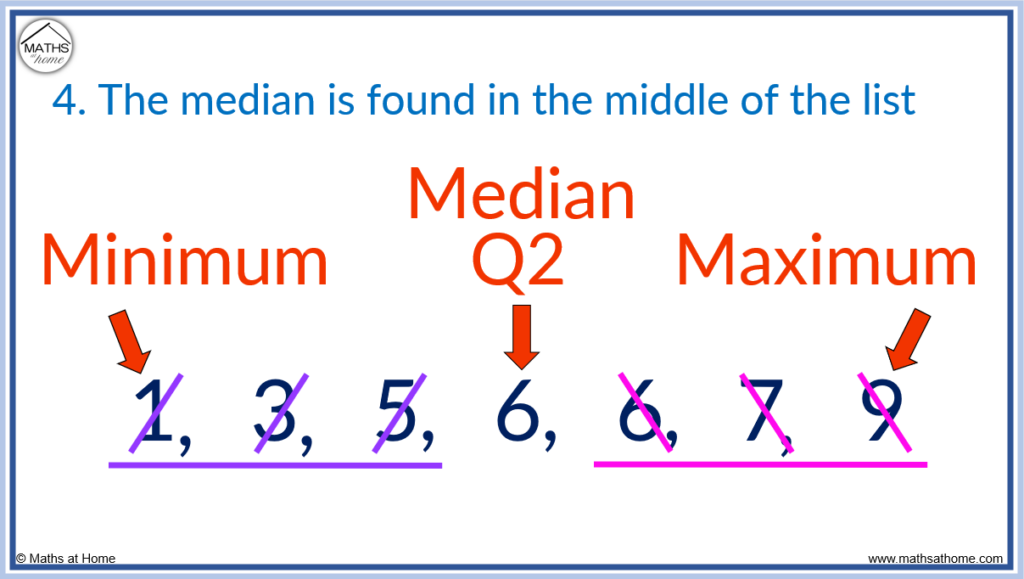
- The median is found in the middle of the list.
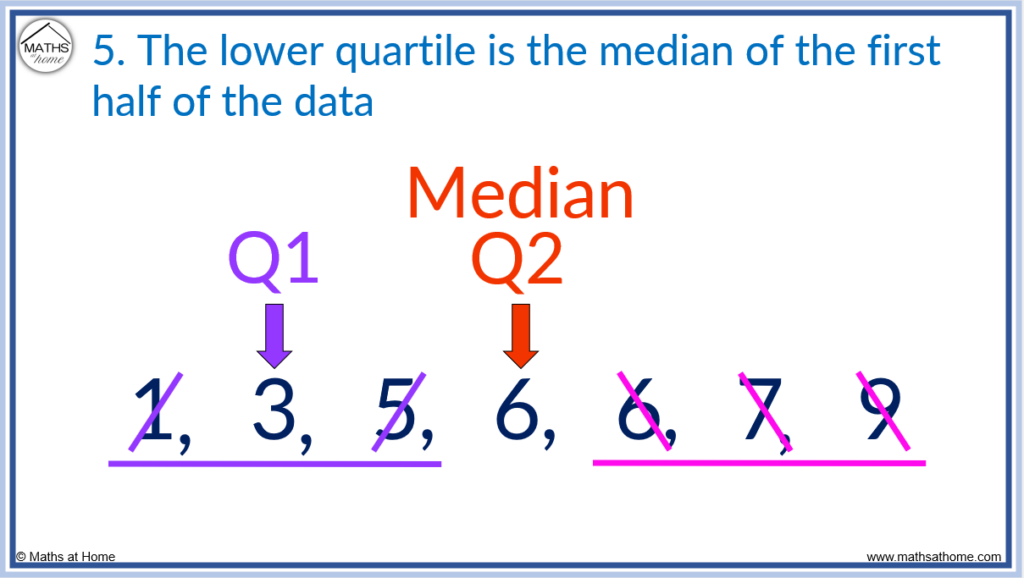
- The lower quartile is the median of the first half of the data.
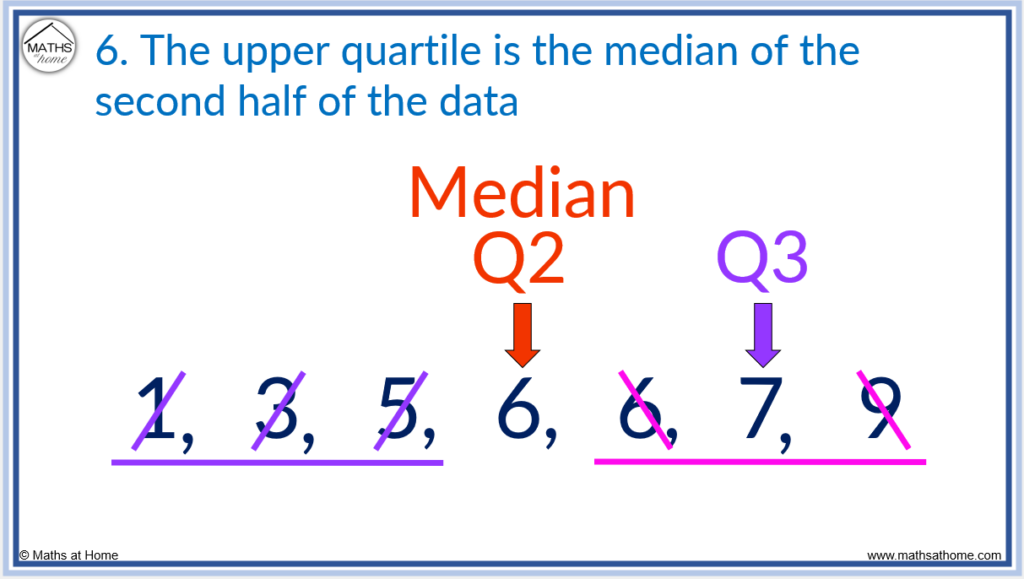
- The upper quartile is the median of the second half of the data.
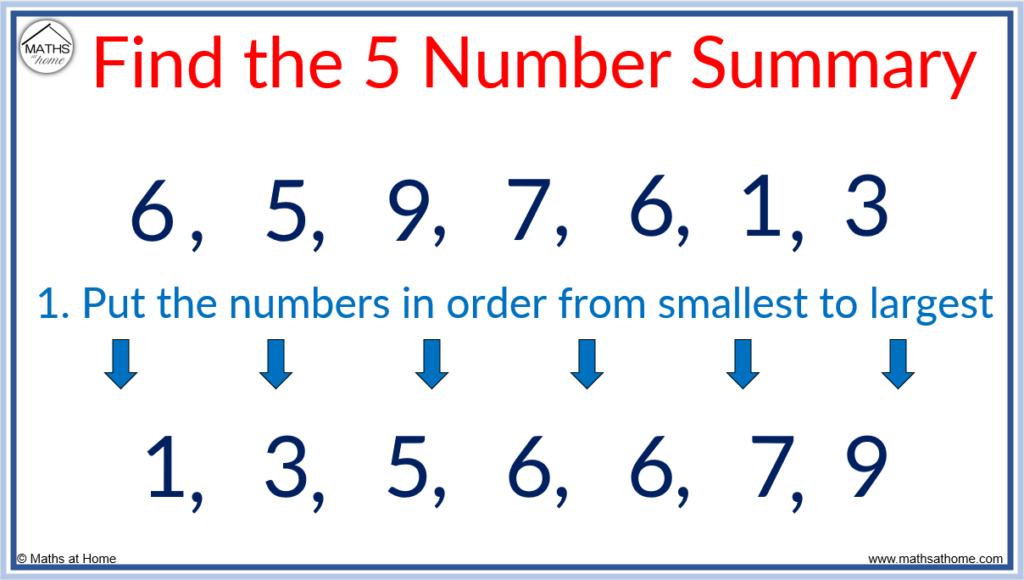
For example, find the five number summary of 6, 5, 9, 7, 6, 1, 3.
Step 1. Put the numbers in ascending order from smallest to largest
Written from smallest to largest 6, 5, 9, 7, 6, 1, 3 is written as 1, 3, 5, 6, 6, 7, 9.
It is useful to count the number of data points to check that we have not missed any numbers out.
There are 7 numbers in both lists so we know that we have not missed any out.
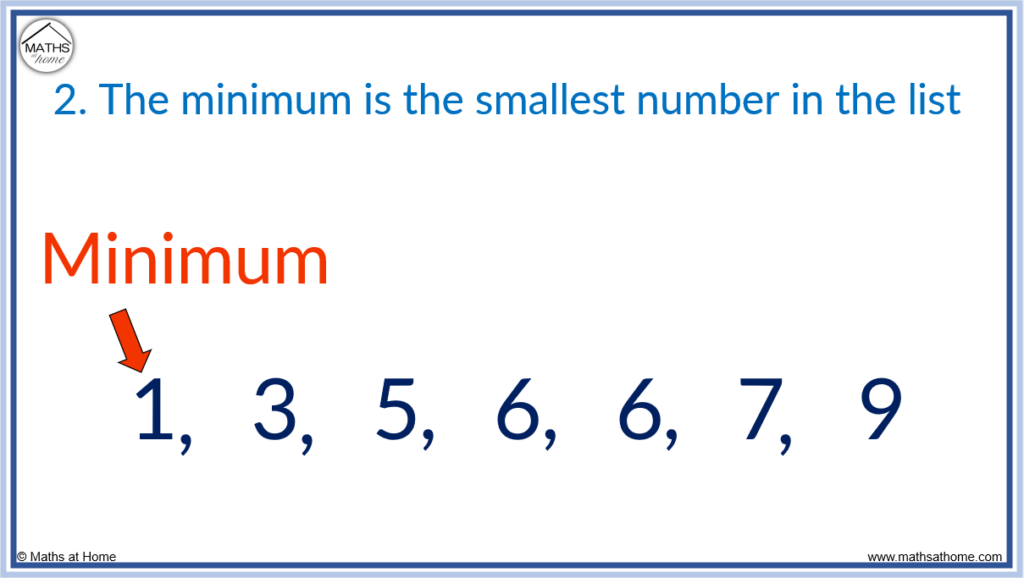
Step 2. The minimum is the smallest number in the list
Now that the numbers are written in order, the minimum is found at the start of the list.
The minimum is the smallest number in the data set.
In this example, the minimum is 1.
Step 3. The maximum is the largest number in the list
The maximum is the largest number in the list of data.
In this example, the maximum is 9.
Step 4. The median is found in the middle of the list
The second quartile(Q2) is also known as the median. It is found in the middle of an ordered set of data. To find the second quartile, cross off the same amount of numbers at each end of the list until there is one number remaining. If there are two numbers remaining, the second quartile is found directly in between them.
For the list 1, 3, 5, 6, 6, 7, 9, the second quartile is found by crossing off three numbers at each end.
1, 3, 5, 6, 6, 7, 9.
The second quartile (Q2) is 6.
Step 5. The lower quartile is the median of the first half of the data
To find the lower quartile, look at the numbers before the median and then find the median of these numbers.
In the list 1, 3, 5, 6, 6, 7, 9 the median is 6.
The numbers to the left of the median are 1, 3, 5. We find the median of these numbers to find the lower quartile (Q1).
Crossing off one number on the left and right we get 1, 3, 5. Therefore the lower quartile is 3.
Step 6. The upper quartile is the median of the second half of the data
To find the upper quartile (Q3), look at the numbers after the median and then find the median of these numbers.
In the list 1, 3, 5, 6, 6, 7, 9 the numbers after the median are 6, 7, 9.
The median of 6, 7, 9 is found by crossing off one number on the left and right so that the median is 7.
The five number summary of the data set is:
- Minimum = 1
- Lower Quartile (Q1) = 3
- Median (Q2) = 6
- Upper Quartile (Q3) = 7
- Maximum = 9
Example of Finding a Five Number Summary with an Even Set of Data
When finding the median of an even set of data, cross the same amount of numbers off at each end until two numbers remain in the middle. Then add these two numbers and divide by two. The same process is used when finding the lower quartile and upper quartile by finding the median of the first and second halves of the data respectively.
An even set of data is a list of data in which the total amount of numbers is even.
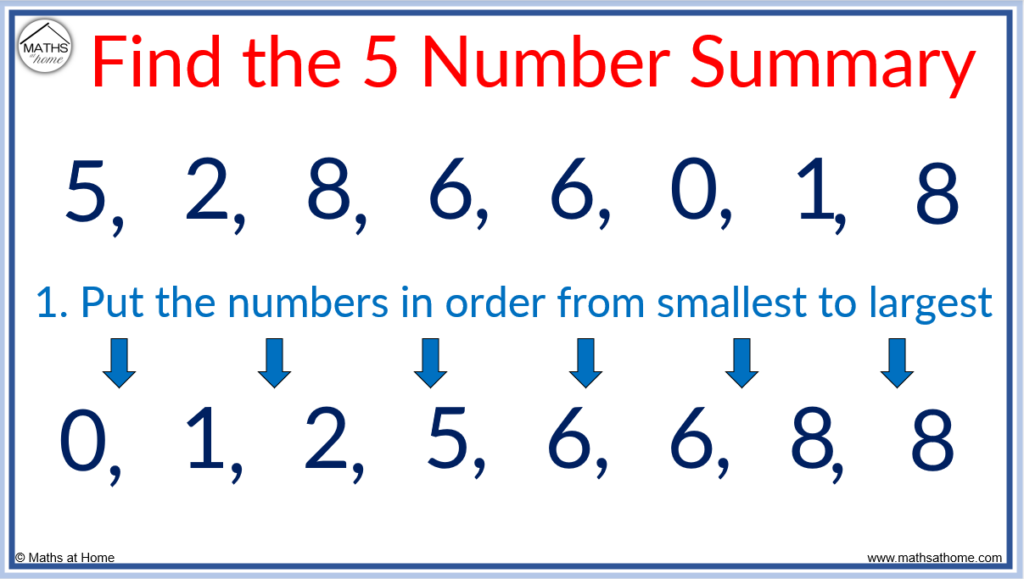
For example, the data list 5, 2, 8, 6, 6, 0, 1, 8 contains 8 numbers and so, it is an even data set.
Step 1. Put the numbers in order from smallest to largest
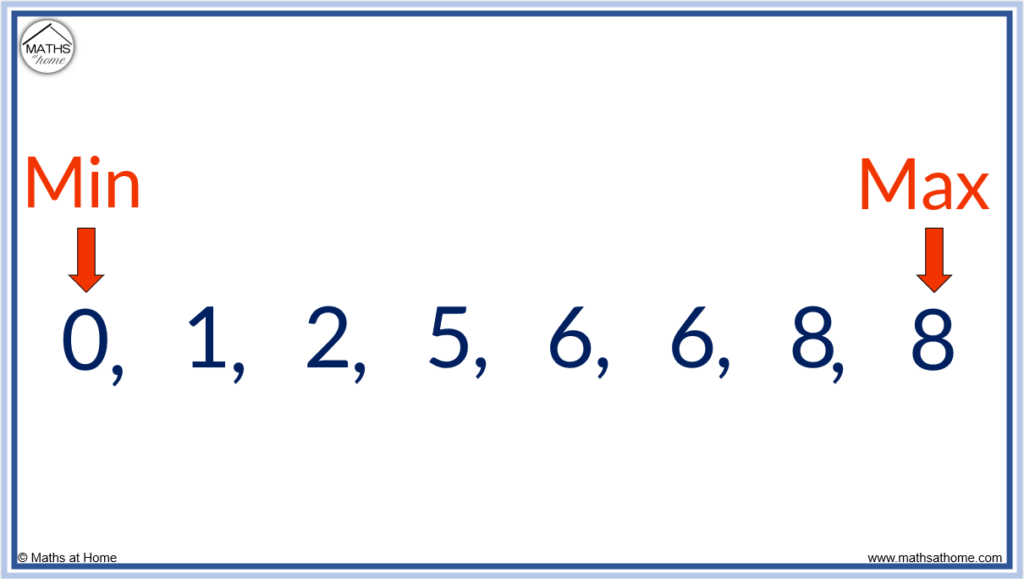
Step 2. The minimum is the smallest number in the list
Step 3. The maximum is the largest number in the list
Both of these steps can be completed at once by reading the smallest and largest numbers in the list.
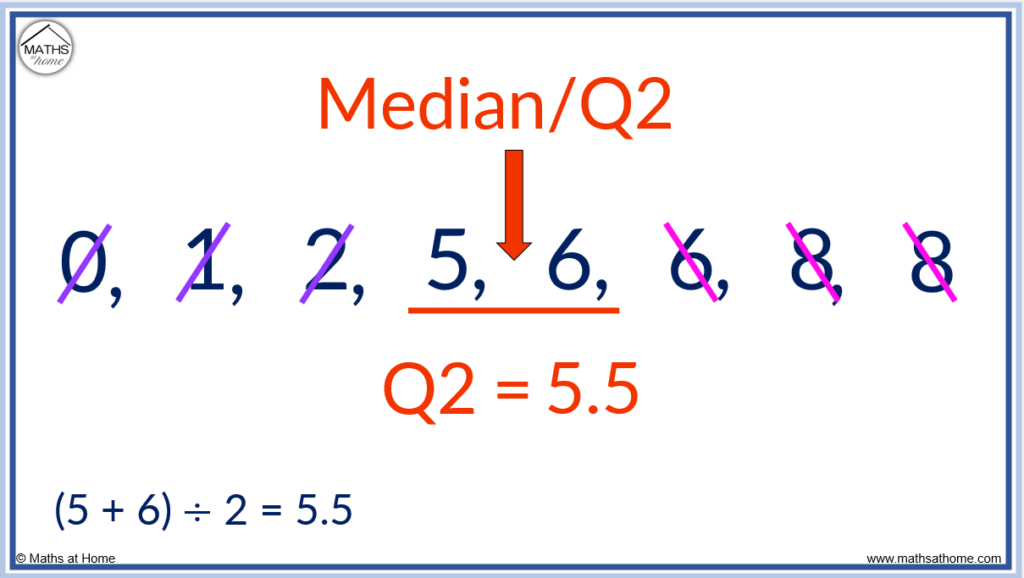
Step 4. The median is found in the middle of the list
To find the median of an even set of data, cross off the same amount of numbers at each end of the list until two numbers remain. Then add these two numbers and divide by 2.
In this example, the two numbers remaining are 5 and 6.
The median is found by adding 5 and 6 to get 11 and then dividing this by 2 to get 5.5.
We can also see that 5.5 is directly in the middle of 5 and 6.
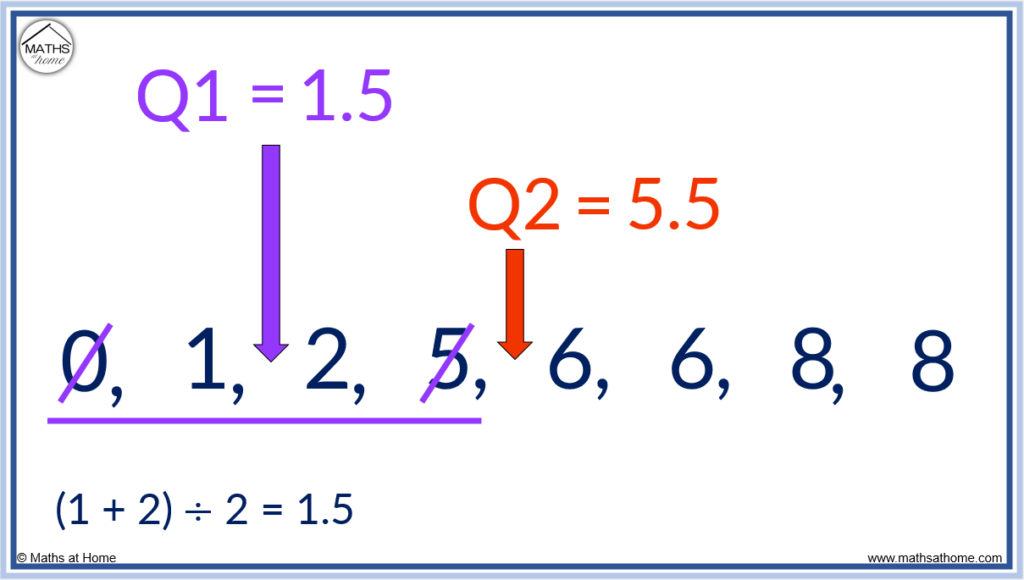
Step 5. The lower quartile is the median of the first half of the data.
To find the lower quartile, look at all numbers to the left of the median and find the median of these.
The median is 5.5 and the numbers to the left of the median are 0, 1, 2, 5.
The lower quartile is found by finding the median of 0, 1, 2 and 5. We cross off 0 and 5 to leave 1 and 2.
The lower quartile (Q1) is found directly between 1 and 2 at 1.5.
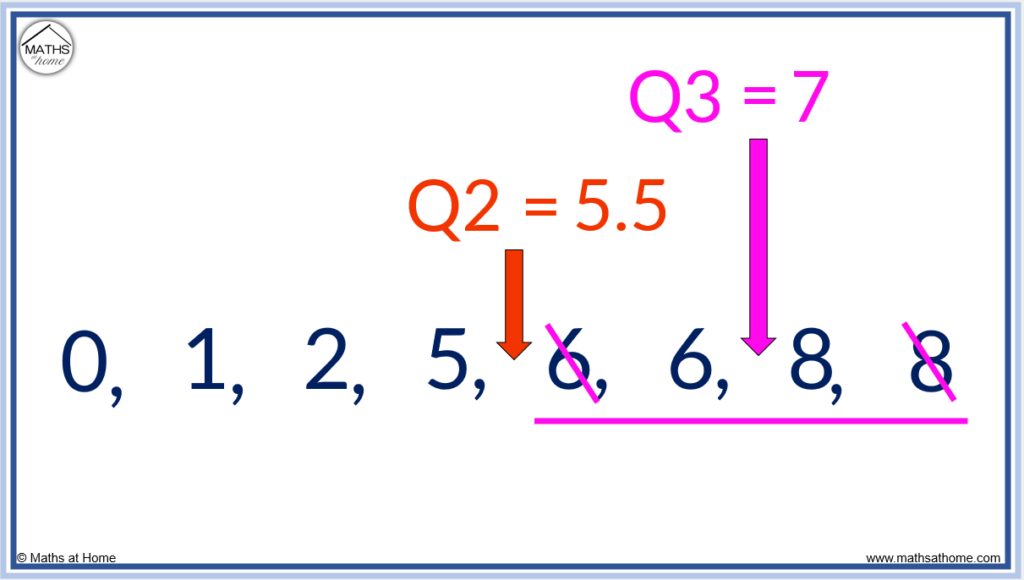
Step 6. The upper quartile is the median of the second half of the data
To find the upper quartile (Q3), look at the numbers after the median and find the median of these numbers.
In this example, the numbers after the median of 5.5 are 6, 6, 8 and 8.
We find the median of 6, 6, 8, 8 by crossing off one number at each end to leave 6 and 8 in the middle.
The upper quartile is found directly between 6 and 8. The upper quartile is 7.
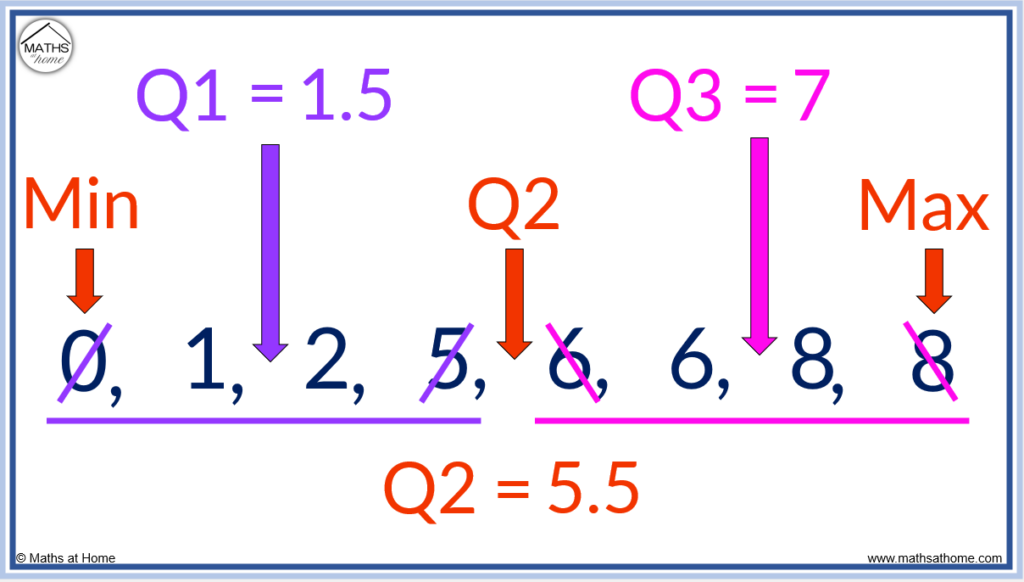
The five number summary is:
- Minimum = 0
- Lower Quartile (Q1) = 1.5
- Median (Q2) = 5.5
- Upper Quartile (Q3) = 7
- Maximum = 9
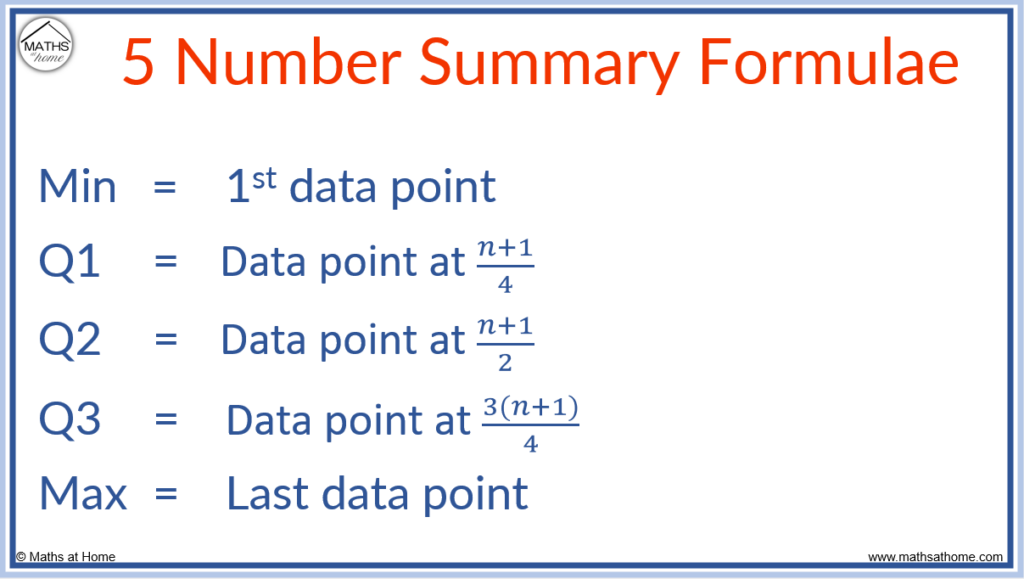
5 Number Summary Formula
Where ‘n’ is the number of data points written in order:
- The median (Q2) is found at the (n+1)/2 data point.
- The lower quartile (Q1) is found at the (n+1)/4 data point.
- The upper quartile (Q3) is found at the 3(n+1)/4 data point.
- The minimum is found at the 1st data point and the maximum is found at the last data point.
With larger data sets, the five number summary is found more easily using the formulae. Simply count the number of data points and enter this value as n into the formulae below.
The numbers produced are not the values of Q1, Q2 or Q3. Instead, they are positions of Q1, Q2, Q3. The numbers indicate how many numbers in we need to count to find Q1, Q2 and Q3.
If the number produced is a decimal, this means to look in between the numbers either side of this decimal. For example if the value produced is 2.5, look between the 2nd and 3rd number.
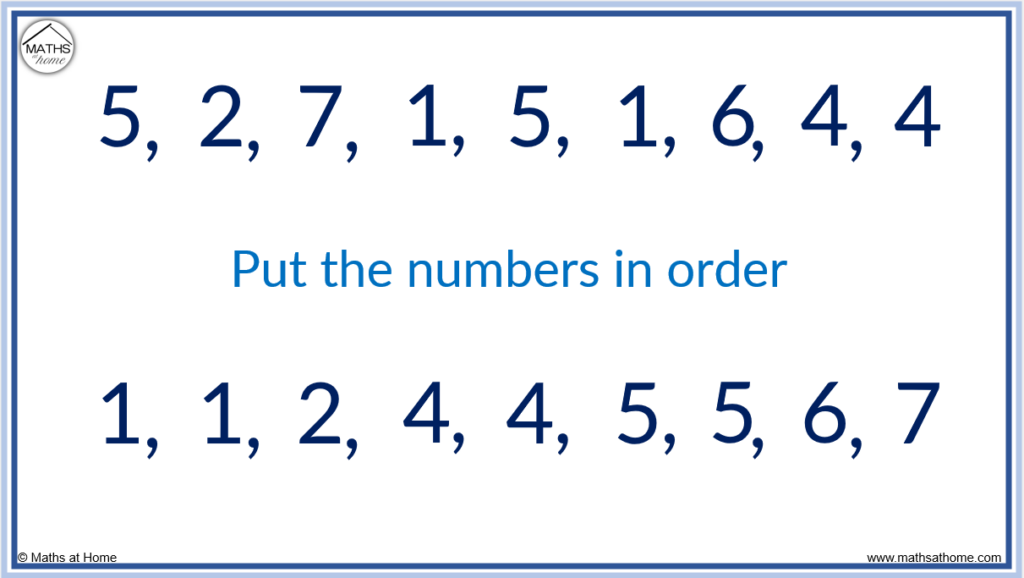
For example, use the 5 number summary formulae with the data set 5, 2, 7, 1, 5, 1, 6, 4, 4.
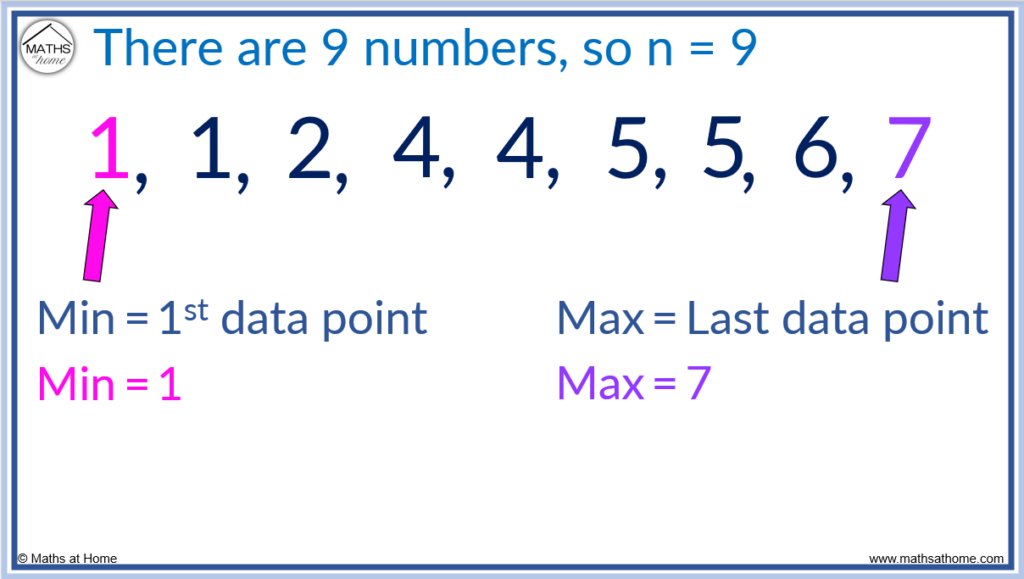
There are 9 numbers in total, so n = 9.
First put the numbers in order from smallest to largest.
The minimum and maximum are found at the first and last data points respectively.
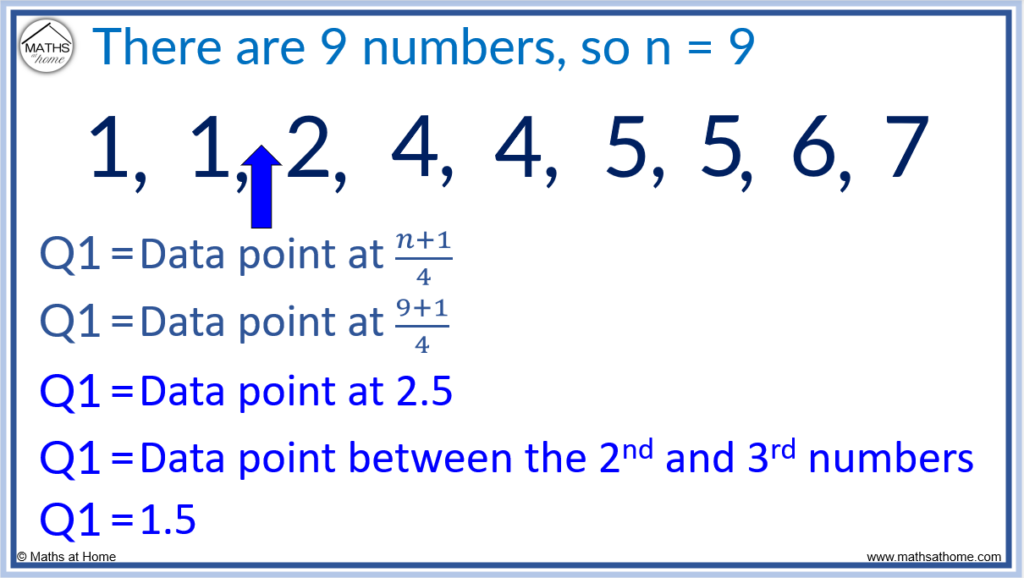
The formula for the lower quartile is Q1 = (n+1)/4 th data point.
There are 9 numbers so n = 9.
(9+1)/4 = 2.5 which means that the lower quartile is found directly in between the 2nd and 3rd number in the list.
The 2nd number is 1 and the 3rd number is 2. Halfway between and 1 and 2 is 1.5.
The lower quartile (Q1) = 1.5
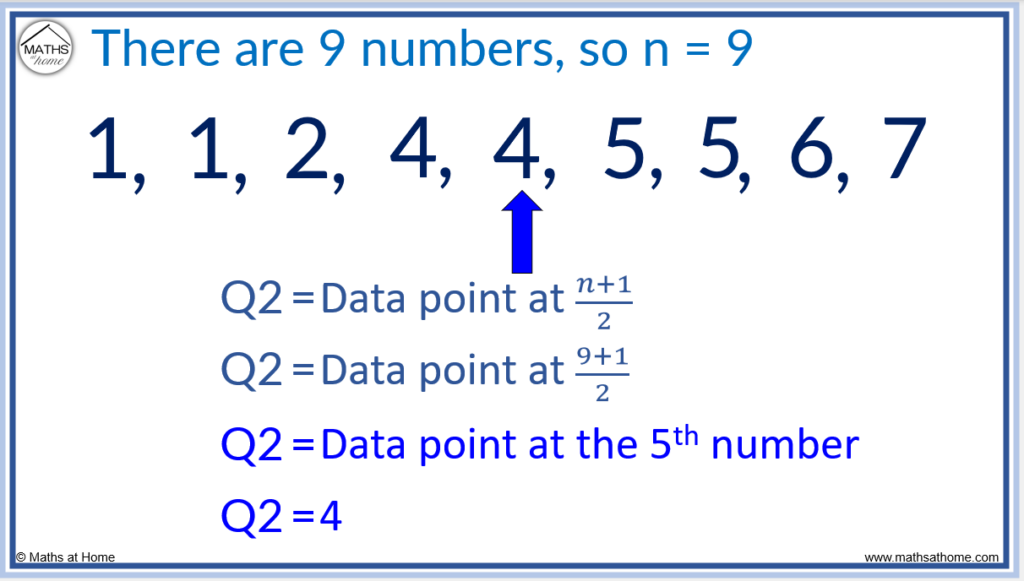
The formula for the median is Q2 = (n+1)/2 th data point.
n = 9 and so Q2 = (9+1)/2 th data point.
(9+1)/2 = 5 and so the median is found at the 5th number along.
The median is 4.
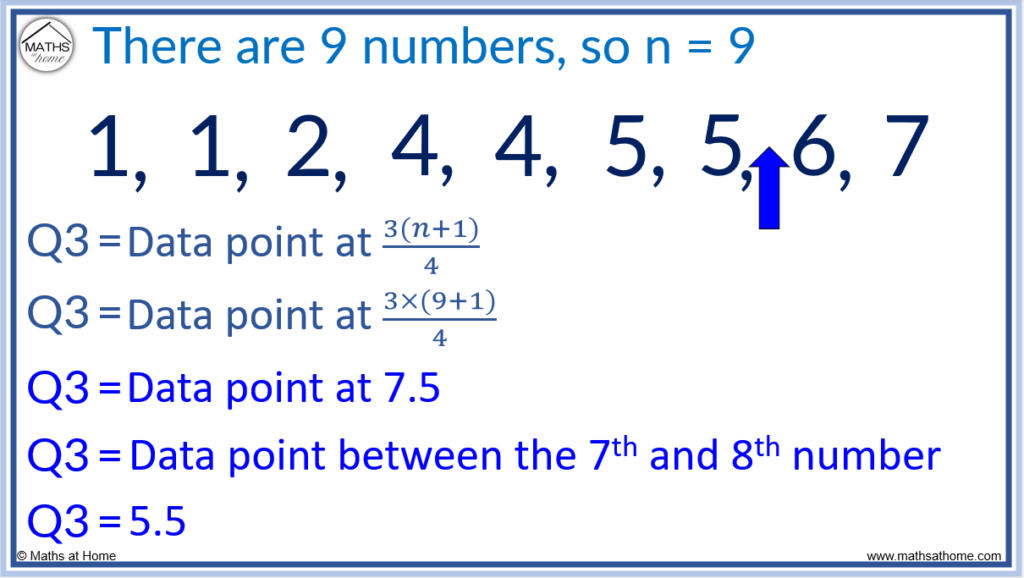
The formula for the upper quartile is Q3 = 3(n+1)/4 th data point.
n = 9 and so Q3 = 3×(9+1)/4 th data point.
3×(9+1)/4 = 7.5 and so the upper quartile is found between the 7th and 8th numbers.
The 7th number is 5 and the 8th number is 6. Therefore the upperquartile Q3 is 5.5.
Outliers and the 5 Number Summary
An outlier is a value in a data set that is significantly different from the other values. An outlier is defined as any value that is more than 1.5×IQR below Q1 or more than 1.5× IQR above Q3.
For example, find the boundaries for outliers for a data set with the following five number summary:
Minimum = 5. Q1 = 10. Q2 = 18. Q3 = 20. Maximum = 25.
Outliers are any values that are less than Q1-1.5×IQR or more than Q3+1.5×IQR.
First, calculate IQR = Q3 – Q1.
The IQR = 20 – 10. The IQR = 10.
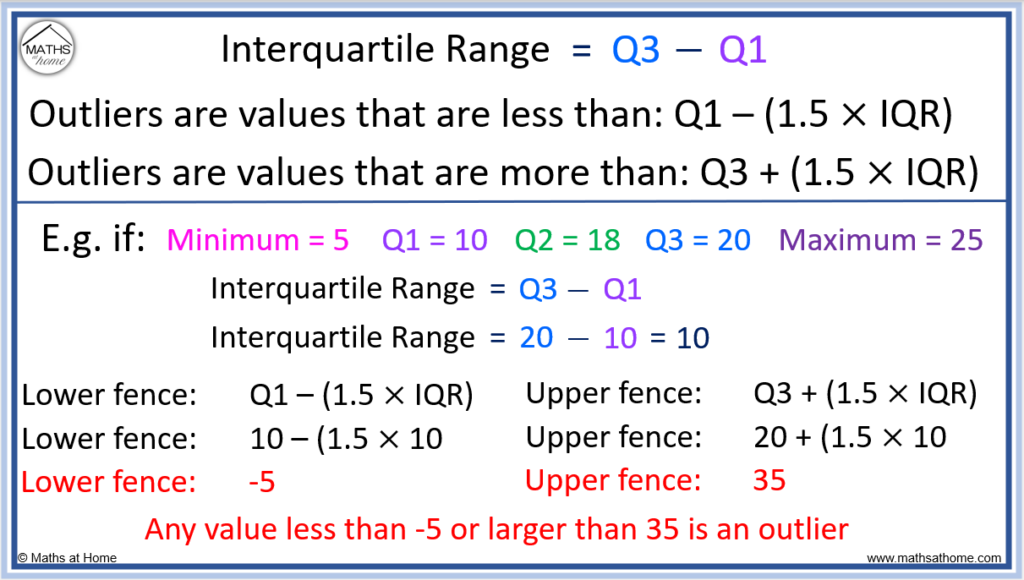
The lower fence for outliers = Q1-1.5×IQR.
For this data, the lower fence = 10-1.5×10.
This equals -5 and therefore any piece of data less than -5 could be an outlier.
The upper fence for outliers = Q3+1.5×IQR.
For this data, the upper fence = 20+1.5×10.
This equals 35 and therefore any piece of data larger than 35 could be an outlier.
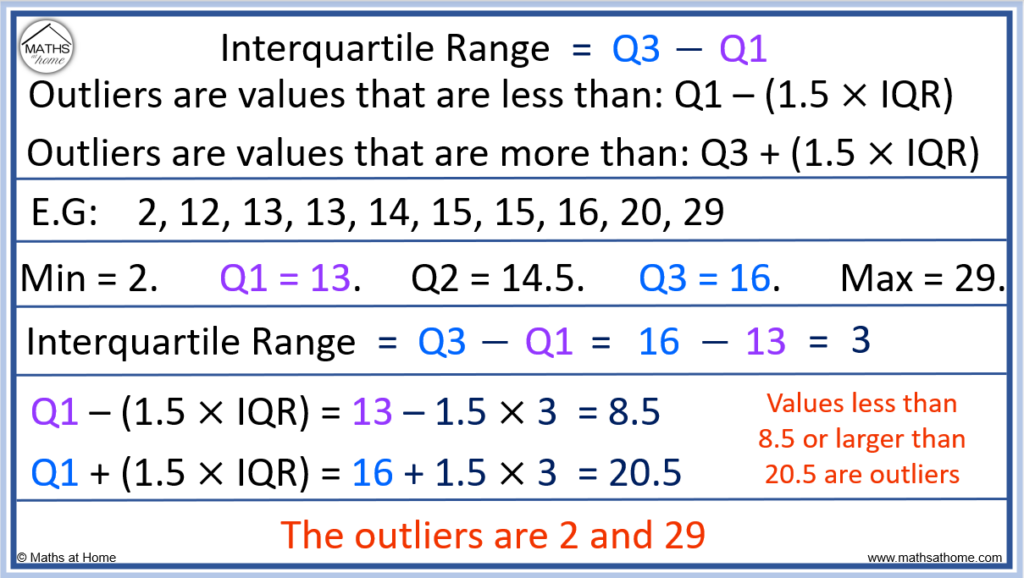
Here is an example of identifying outliers from a list using the IQR.
How to Find a 5 Number Summary using Excel
To find the 5 number summary using excel:
- Enter the data in a column.
- Type ‘=MIN()’, select between the brackets and highlight the data.
- Type ‘=MAX()’, select between the brackets and highlight the data.
- Type ‘=MEDIAN()’, select between the brackets and highlight the data.
- Type ‘=QUARTILE.EXC(,1)’ and before the comma, highlight the data for the 1st quartile.
- Type ‘QUARTILE.EXC(,3)’ and before the comma, highlight the data for the 3rd quartile.
See the example below to see how the functions are used.
In this example, the data set is found between cells A1 and A13.
Therefore within the brackets of each function we have A1:A13.
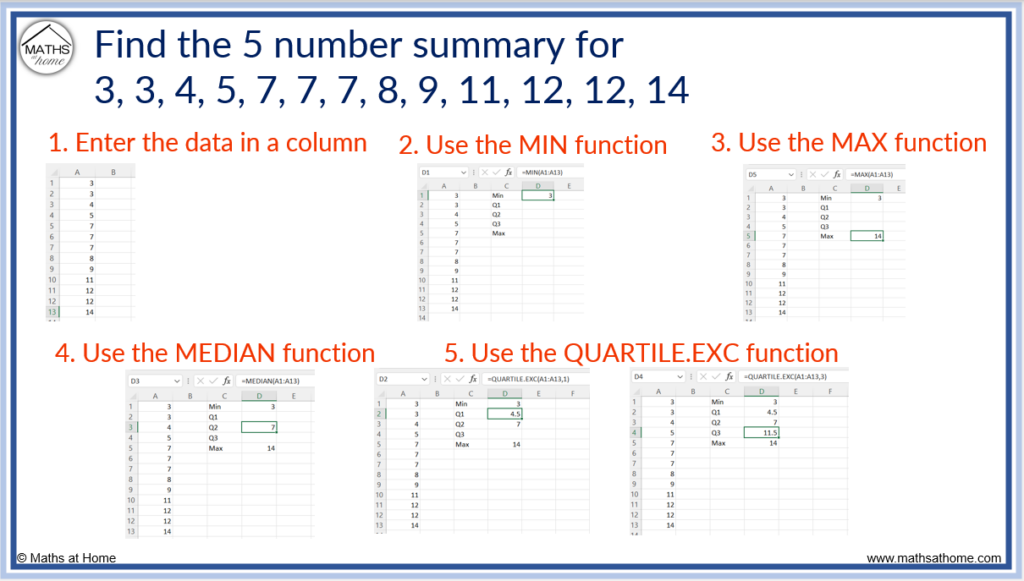
With the QUARTILE.EXC() function, the number after the comma is used to decide which quartile is needed. So =QUARTILE(A1:A13, 1) gives us the first quartile and =QUARTILE(A1:A13, 3) gives us the 3rd quartile.
The 5 number summary for this set of data is:
- Minimum = 3
- Lower Quartile (Q1) = 4.5
- Median (Q2) = 7
- Upper Quartile (Q3) = 11.5
- Maximum = 14
How to Find the 5 Number Summary on a Ti-84 Calculator
To find the number summary on a Ti-84:
- Press [STAT], select [EDIT] and enter the data values into the L1 column.
- Press [STAT], scroll right to [CALC] and select 1-Var Stats.
- Select Calculate and scroll down to view the 5 number summary.
For example, find the 5 number summary for the data set: 3, 3, 4, 5, 7, 7, 7, 8, 9, 11, 12, 12, 14.
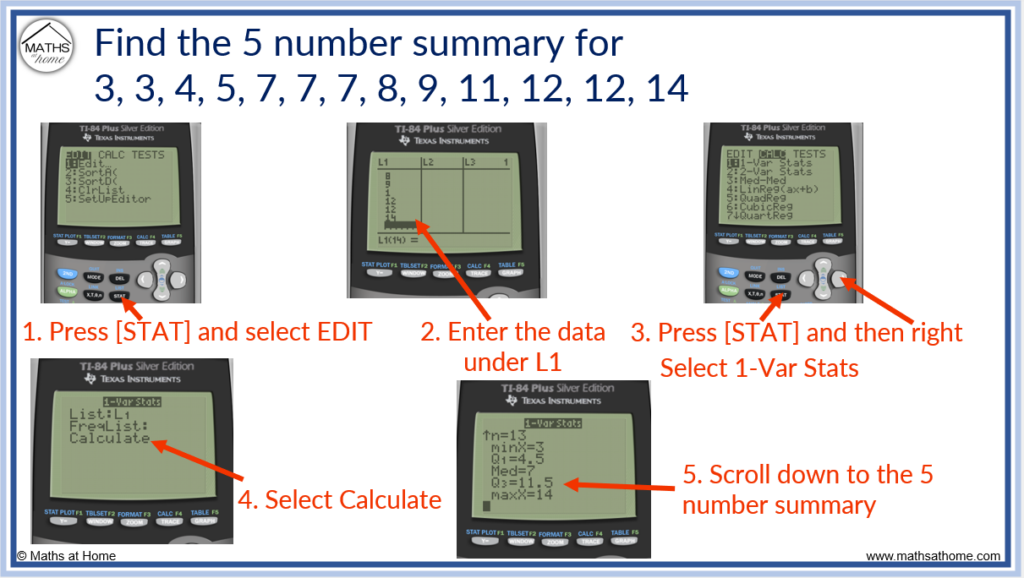
The 5 number summary for this set of data is:
- Minimum = 3
- Lower Quartile (Q1) = 4.5
- Median (Q2) = 7
- Upper Quartile (Q3) = 11.5
- Maximum = 14
Troubleshooting
- It is important to make sure that before pressing ‘Calculate’, the ‘List’ selected on the same screen matches up with the list containing the data.
- Make sure that all other values entered in the list are deleted using the delete button. Do not enter any unnecessary values and do not enter any zeros unless there are zeros in the data.