Probability Tree Video Lessons
Independent Probability Trees: Video Lesson
Conditional Probability Trees: Video Lesson
How to Draw a Probability Tree
To make a probability tree:
- Draw a branch for each outcome of the first event.
- Write the outcome at the end of each branch.
- Write the probability of each outcome next to the corresponding branch.
- For further events, draw new branches coming out of the ends of each preceding outcome.
When drawing probability trees, use the following rules:
- Outcomes are written at the end of each branch
- Probabilities are drawn next to each branch
- Draw branches for each event above each other
- The probabilities on the branches for each event must add to 1
- Branches for new events are drawn on the right of the outcomes which come before them
How to Calculate Probabilities Using a Probability Tree
To calculate probabilities using a probability tree:
- Identify the paths through the tree that contain the desired outcomes.
- Multiply the probabilities on the branches of each of these individual paths.
- Add together all of the probabilities from the paths that give the desired outcomes.
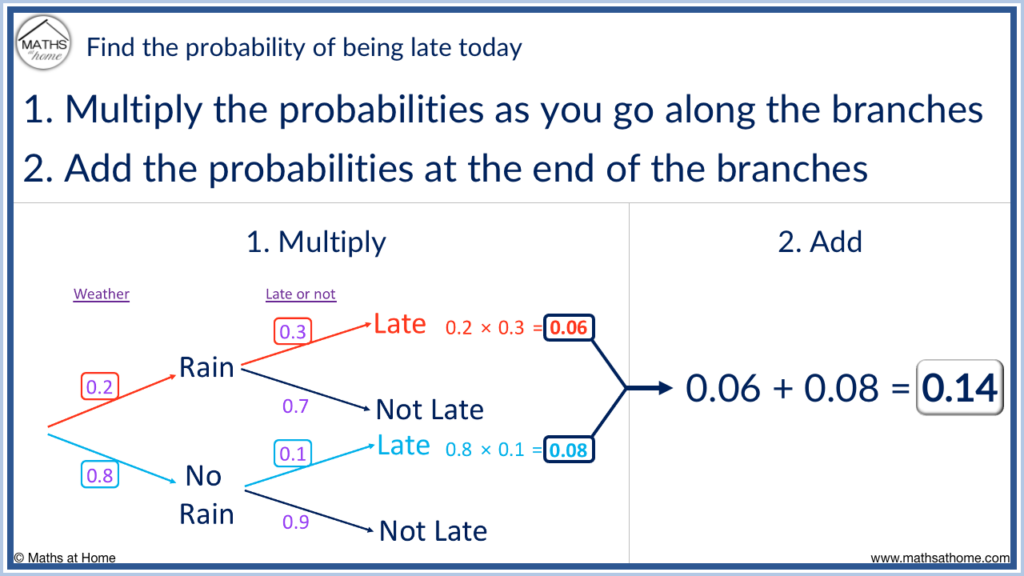
Here is an example of how to do a probability tree. The probability of it raining is 0.2. If it rains, the probability I am late is 0.3 and if it doesn’t rain, the probability of me being late is 0.1.
Step 1. Identify the desired outcomes
The desired outcomes are those that result in a late.
That is, if it rains and then we are late or if it does not rain and then we are late.
Step 2. Multiply the probabilities on the branches of the desired outcomes
The probability of rain is 0.2 and the probability of being late given it has rained is 0.3.
0.2 × 0.3 = 0.06 and so, the probability of it raining and then being late is 0.06.
The probability of no rain is 0.8 and the probability of being late given it has rained is 0.1.
0.8 × 0.1 = 0.08 and so, the probability of it not raining and then being late is 0.08.
Step 3. Add the probabilities of all desired outcomes
There are two pathways that produce the desired outcome of being late.
The probability of it raining and then being late is 0.06.
The probability of no rain and then being late is 0.08.
0.06 + 0.08 = 0.14 and so, the probability of being late is 0.14.
Probability Trees with Fractions
On a probability tree, fractions can be used to represent the probability of each outcome. The fractions are written on each branch. To find the probability of two or more outcomes occurring, multiply the fractions that are written on the branches of these outcomes.
When multiplying fractions, the answer is also a fraction.
- Multiply the numerators together to find the numerator of the answer.
- Multiply the denominators together to find the denominator of the answer.
- Simplify the fraction if possible.
Here is a probability tree showing a coin which is tossed twice.
To make a probability tree for tossing a coin:
- Draw two branches for the two outcomes of heads and tails
- The probability of both heads and tails is 1/2 since both outcomes are equally likely on a fair coin
- Label the two branches with the probability of 1/2
- Repeat these two branches coming out of each heads and tails outcome for however many times the coin is tossed
In this example, the coin is tossed twice, so heads and tails branches are drawn for the first coin toss and then another 2 sets of heads and tails branches are drawn coming out of the outcomes for the second toss.
If we get a heads on the first toss, we can then get a heads or a tails on the second toss.
If we get a tails on the first toss, we can then get a heads or a tails on the second toss.
The probability of tossing a heads or a tails does not change. It is always 1/2.
To find the probability of getting two heads in a row, multiply the two fractions that are found next to heads on the first coin and heads on the second coin.
We have 1/2 × 1/2.
For the numerator of our answer, 1 × 1 = 1.
For the denominator of our answer, 2 × 2 =4.
1/2 × 1/2 = 1/4 and so the probability of tossing two heads in a row is 1/4.
Probability Trees with Decimals
Decimals can be used to represent probabilities on a probability tree diagram. Simply multiply the decimals found on the branches of the required outcome. When multiplying decimals, the answer will always have the same number of decimal places as the decimals being multiplied combined.
For example, a biased coin has a probability of heads = 0.9. It is tossed twice. Find the probability of obtaining a heads or a tails in any order.
In probability, biased means that the outcomes do not all have an equal chance of occurring. The probabilities of the outcomes will be different.
A fair coin would have a probability of heads equal to 0.5 and a probability of tails equal to 0.5. On this biased coin, the probability of heads is 0.9 and so, the probability of tails is 0.1. Remember that the probabilities on any set of branches must add up to 1.
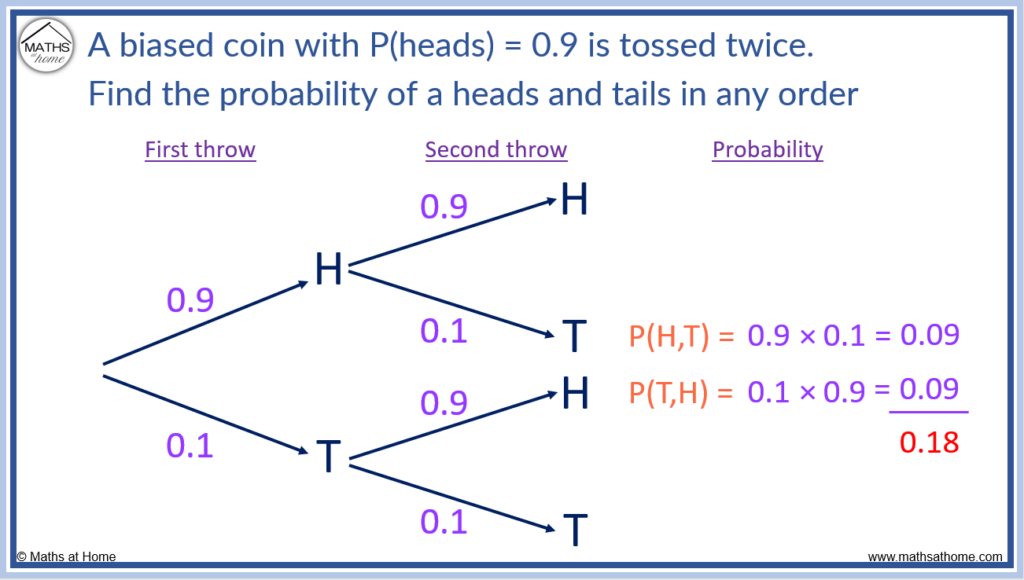
When tossing a coin twice, to obtain a heads and tails in any order, there are two outcomes. Either a heads first then a tails or a tails first then a heads.
The probabilities are found by multiplying the decimals on each path.
The probability of a heads then tails is 0.9 × 0.1 = 0.09.
The probability of a tails then heads is 0.1 × 0.9 = 0.09.
To multiply decimals, simply ignore the decimal point and any zeros in front of the non-zero digits.
We just multiply 1 × 9 to get 9.
Then the answer needs to have the same number of decimal places as the decimals in the question combined.
In the question of 0.1 × 0.9, the 0.1 has 1 decimal place and the 0.9 has 1 decimal place. In total there are 2 decimal places in the question and so the answer of 0.09 also has two decimal places.
Probability Trees For Independent Events
Events are independent if the outcome of the first event has no impact on the probabilities in the second event. When drawn on a probability tree, the probabilities of a particular outcome will always remain the same regardless of any other outcomes.
Rolling a dice is an example of an independent event. The number obtained on the first roll of the dice does not effect the probabilities on the following roll of a dice.
The probability of rolling a particular number on a dice is always 1/6.
If the number 2 was obtained on the first roll, it is still a 1/6 chance of rolling a 2 on the next roll of the dice.
Find the probability of not rolling a 2 on 4 rolls of a dice.
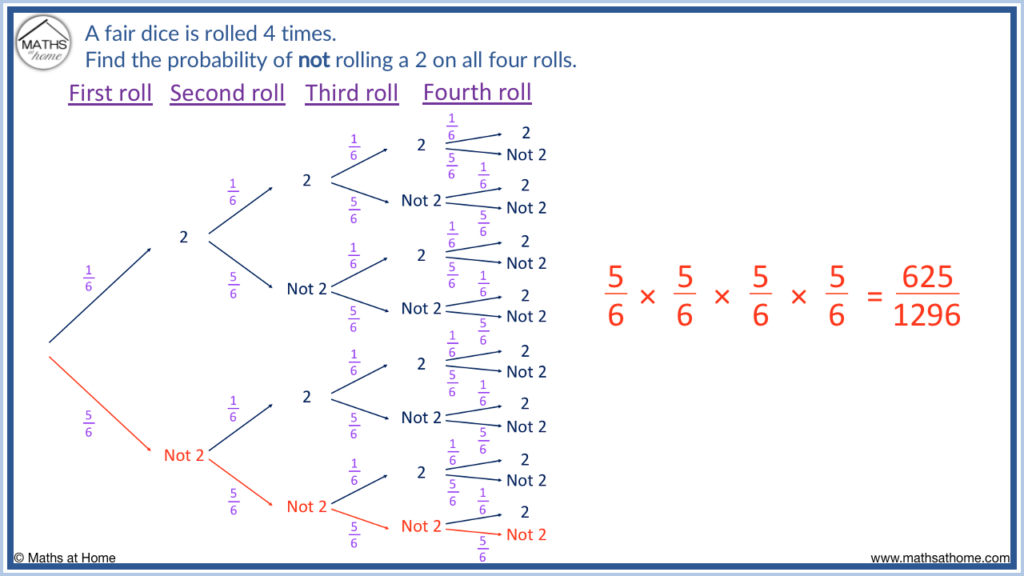
The probability of rolling a 2 is 1/6 and so, the probability of not rolling a 2 is 5/6. This is because 5 out of the 6 numbers are not a 2.
We follow the bottom path on the independent probability tree, where we obtain ‘not 2’, ‘not 2’, ‘not 2’ and ‘not 2’.
This means we multiply 5/6 × 5/6 × 5/6 × 5/6 = 625/1296.
Probability Trees For Dependent Events
Probability trees are particularly useful for representing dependent events. Dependent events are when the probability of an outcome depends on the outcome of the event before it. Simply draw the relevant branches coming out of the outcomes of the previous event.
For example, there are 3 red marbles and 7 blue marbles in a box. A marble is taken out and not replaced and then a second marble is taken out.
Because the first marble is not replaced, the probabilities when taking the second marble are now different to the probabilities for the first marble.
The probability of selecting a red or a blue for the second marble also depends on the colour of the first marble that was removed. Therefore we say these are dependent events.
On the tree below, the first pair of branches shows the outcomes of taking the first marble. We have red on the top and blue on the bottom.
Coming out of the first red outcome are another two branches. These show the probabilities for red and blue if a red was the first marble taken.
Coming out of the first blue outcome are another two branches. These show the probabilities for red and blue if a blue was the first marble taken.
It is helpful to draw a diagram of the objects when considering the probabilities of dependent events.
There were 3 reds and 7 blues to begin with.
If we take a red first, we now only have 2 reds left and 9 marbles in total. The probability of now selecting a second red marble is 2/9. With there still being 7 blues, the probability of selecting a blue becomes 7/9.
If a blue was taken first, we now only have 6 blue marbles out of a total of 9. The probability of now selecting a second blue marble is 6/9. There are still 3 reds and so the probability of selecting a red becomes 3/9.
Now further probabilities can be calculated. For example the probability of selecting two blue counters in a row would be 7/10 × 6/9, which equals 42/90 or 7/15.
Probability Trees With Replacement
Probability trees can be made for events where an object is selected and then replaced before it is selected again. The replacement means that the total number of objects remains the same throughout and therefore the probabilities on each pair of branches remain the same.
For example, there are 6 red marbles and 4 blue marbles in a box. A marble is selected and then replaced. A second marble is then selected.
Replacing the marble means that it is put back into the box. This means that the probabilities for selecting the second marble will be identical to the probabilities for selecting the first marble.
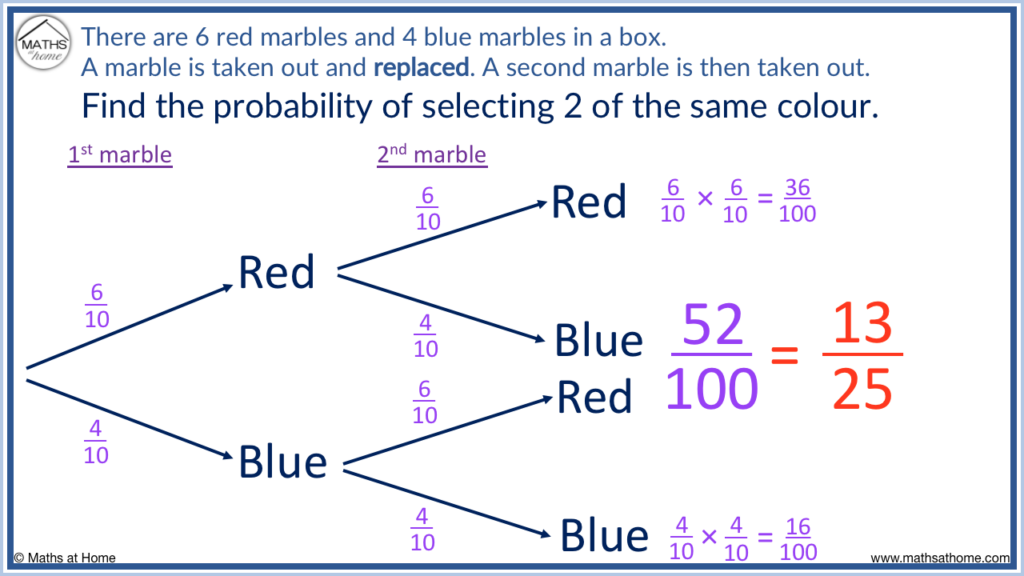
In this example we find the probability of selecting 2 marbles of the same colour.
That is, a red then a red or a blue then a blue.
We multiply the probabilities found on the branches for red and red or blue and blue.
The probability of a red then a red is 6/10 × 6/10 = 36/100.
The probability of a blue then a blue is 4/10 × 4/10 = 16/100.
The total probability of getting any 2 marbles the same colour is found by adding these probabilties together.
36/100 + 16/100 = 52/100. This simplifies to 13/25.
Probability Trees Without Replacement
Probability trees without replacement involve the selection of an object that is not returned after it is chosen. This means that the probabilities have now changed. If there is no replacement, the outcomes of an event are dependent on the outcome of the event before it.
For example, there are 3 red marbles and 7 blue marbles in a box. A marble is taken out and not replaced. A second marble is then taken out.

It helps to draw a diagram to show the outcomes when looking at probability trees without replacement.
This helps us to visualise how the probabilities change.
For example, on the tree diagram above, selecting a red first results in there now only being 2 red marbles left out of 9. Then 7 blue marbles remain out of 9.
However, selecting a blue marble first results in 6 blue marbles left out of 9. There will still be 3 red marbles left out of 9.
Probability Trees With 3 Events
Each event on a probability tree is shown with sets of branches which are aligned above each other. For a probability tree with 3 events, there are three columns of branches. The first event is shown on the left, the second event is in the middle and the third event is on the right.
For example, when a dice is rolled three times, the first roll will be shown on the left, the second roll will be shown in the middle and the third roll will be shown on the right.
Here we want to find the probability of rolling a 5 on all three rolls. Rather than making 6 branches to show all of the numbers from one to 6, it is easier to make a branch that is for rolling a 5 and another branch which is for not rolling a 5.
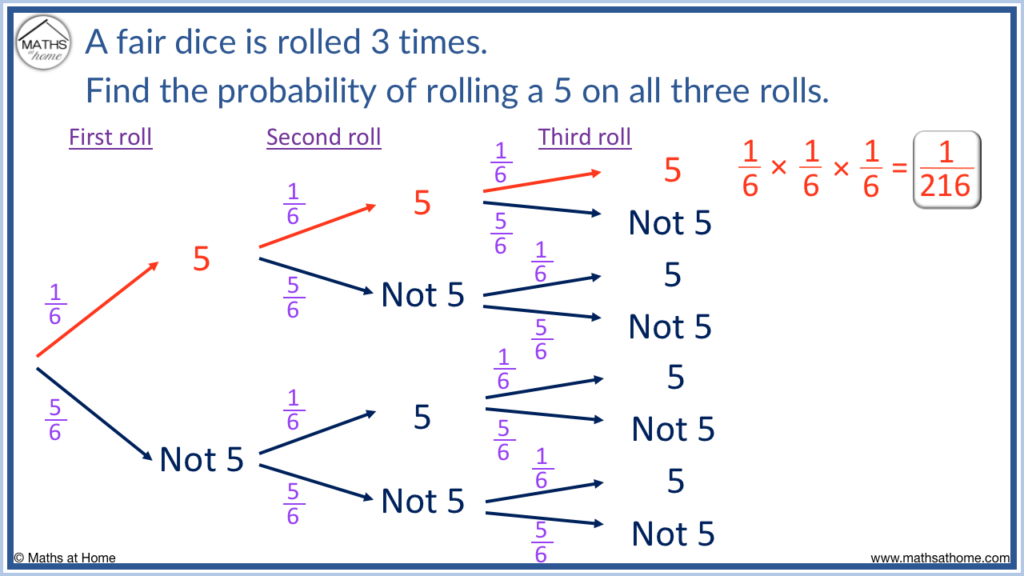
The probability of rolling a dice is 1/6 since there are 6 different outcomes, all with the same likelihood of occurring.
1/6 × 1/6 × 1/6 = 1/216 and so, the probability of rolling three sizes in a row is 1/216.
Probability Trees With 3 Branches
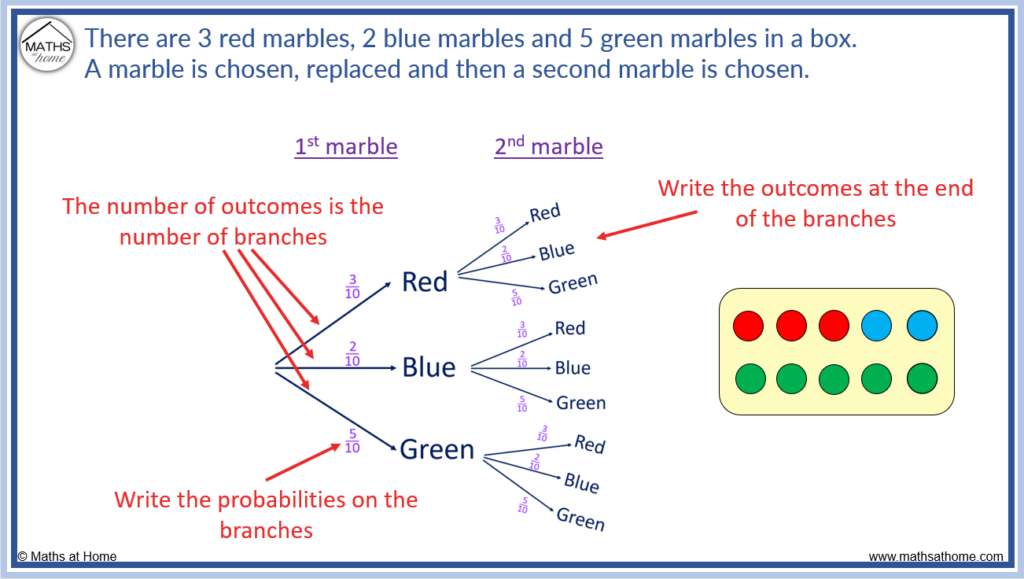
On a probability tree, the number of branches needed is the same as the number of outcomes. If there are 3 possible outcomes, three branches are drawn. For example, if a box contains red, blue and green marbles, then 3 branches are drawn for the outcomes of red, blue and green.
In the example below there are 5 red marbles, 3 blue marbles and 2 green marbles in a box. Since three colours can be chosen, there are three branches on the tree.
When the first marble is taken, we can then take a red, blue or green marble as the second marble chosen. Therefore there are another three branches at the ends of the first marble outcome.
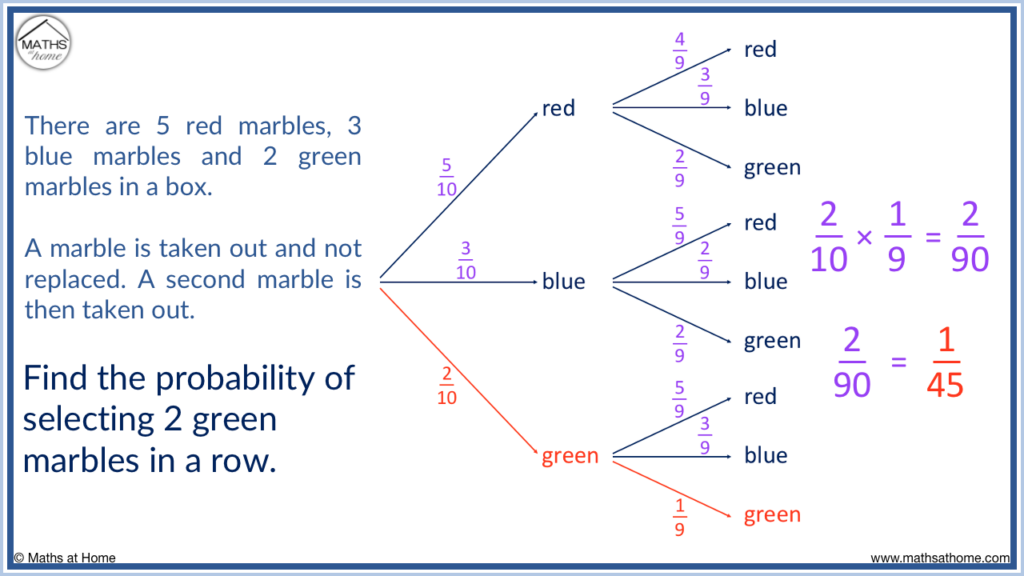
In the example above we find the probability of selecting 2 green marbles in a row.
There are 2 green marbles out of the 10 marbles in total and so, the probability of selecting a green marble the first time is 2/10.
If a green marble is taken, there is now only 1 green marble left. There were 10 marbles but now that one has been taken, there are 9.
Therefore the probability of choosing a second green marble becomes 1/9.
We multiply the two probabilities of getting a green marble together to find the probability of getting two green marbles in a row.
2/10 × 1/9 = 2/90. This can be simplified to 1/45.
Probability Trees with Algebra
Probability trees can also involve algebra. For example, there are n red marbles and n + 2 blue marbles in a box. Two marbles are taken out one after another. Find the probability of selecting 2 blue marbles.
In this example, there are n + n + 2 marbles in total. This means that there are 2n + 2 marbles in the box.
If there are n red marbles out of 2n + 2 marbles in total, the probability of selecting a red marble is n/(2n + 2).
If there are n + 2 blue marbles out of 2n + 2 marbles in total, the probability of selecting a blue marble is (n+2)/(2n + 2).
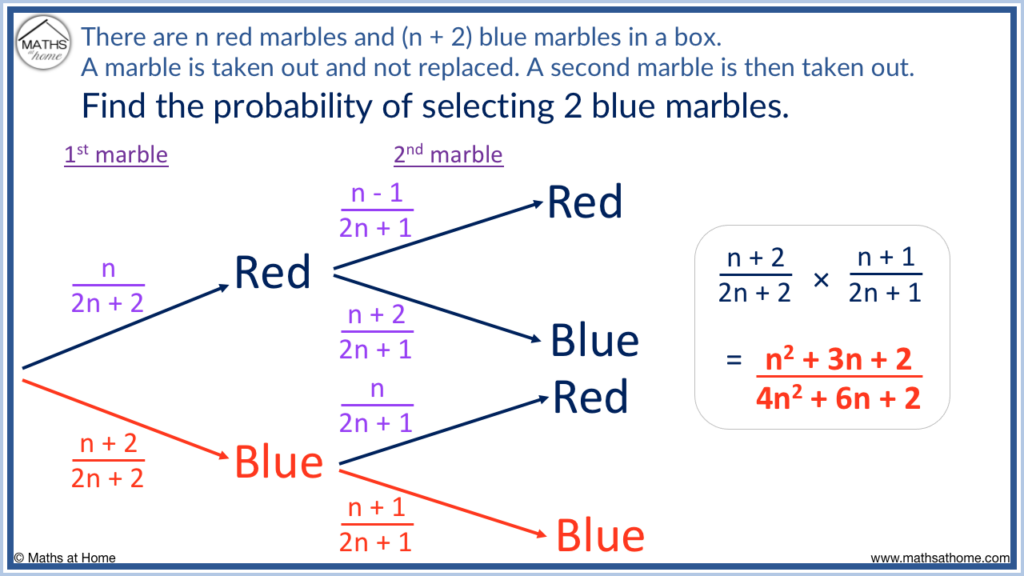
If a red marble is selected, then there is 1 less red marble. We originally had n red marbles and so, we now have n – 1 red marbles.
In total there were 2n + 2 marbles and if one has been selected then there are now 2n + 1 marbles in total because we have subtracted one.
If a red was selected first, the probability of a second red is now (n-1)/(2n + 1) and the probability of a blue is now (n+2)/(2n + 1).
If a blue was selected first, there will be 1 less blue marble. We originally had n + 2 blue marbles and now we will have n + 1 blue marbles. We subtracted one from n + 2 to make n + 1.
The probability of obtaining a second blue is now (n+1)/(2n + 1) and the probability of obtaining a red after a blue is n/(2n + 1).
We can see that on each pair of branches the probabilities always add up to one whole. With algebraic fractions, this means that if we add the numerators on each pair of branches, we obtain the denominator.
For example on the first pair of branches, n + n + 2 = 2n + 2.
On the pair of branches following a red being taken first, we have n – 1 + n + 2 = 2n + 1.
On the pair of branches following a blue being taken first, we have n + n + 1 = 2n + 1.